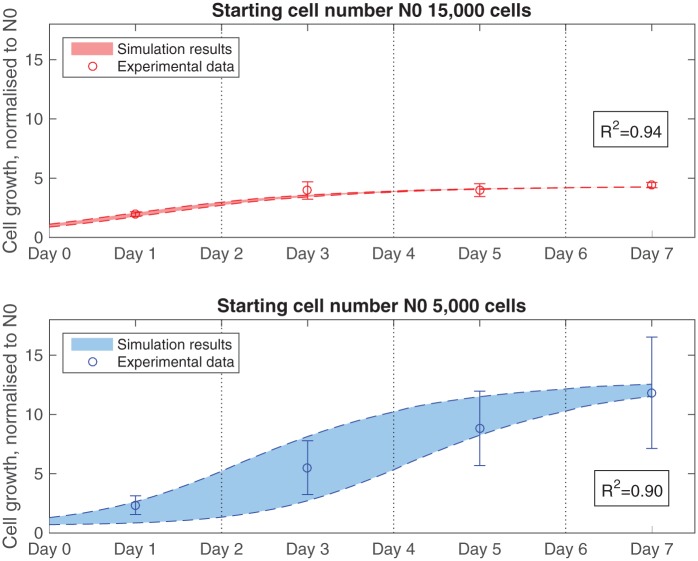
Figure 5.
Model fit to experimental data for control groups with seeding numbers of 5,000 and 15,000 cells. Growth parameters are set as follows: β = 8 × 10⁻⁵ m3/(mol s), d0 = 1.7 × 10³ cells/(m2 s) and Nmax = 2.4 × 10⁹ cells/m2. The average relative standard deviations measured in vitro for each control group, 12% for the 15,000 cells group and 30% for the 5,000 cells group, are used in the simulations. The vertical dotted lines denote the points when model is reset to initial conditions to mimic replacement of the culture medium.

