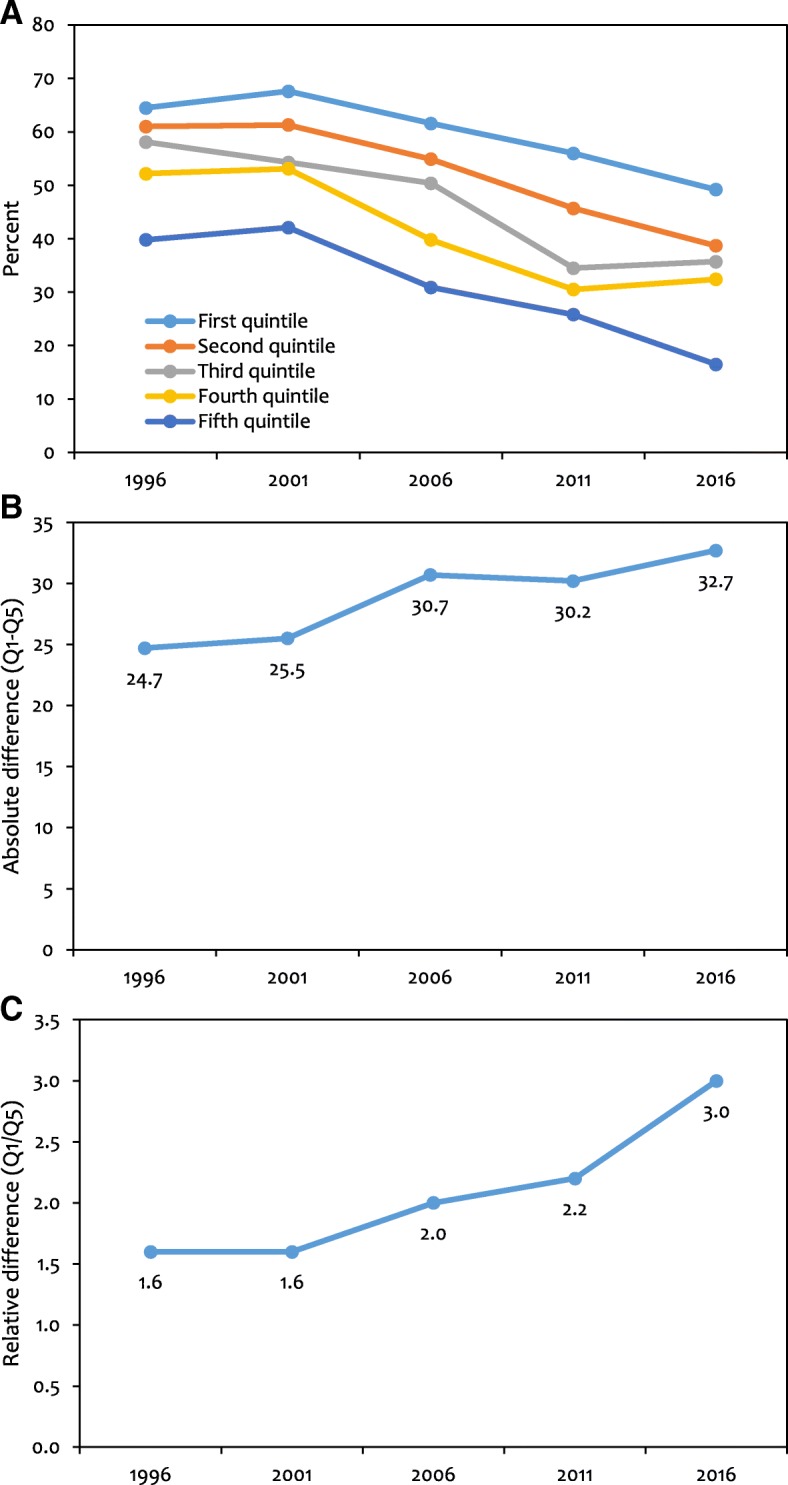
Fig. 1.

Quintile-specific trends in stunting from 1996 to 2016. (a) Stunting prevalence (b) Absolute difference (Q1-Q5) (c) Relative difference (Q1/Q5). The first quintile (Q1) is the 20% poorest quintile and the fifth quintile (Q5) is the 20% richest. (Weighted N: - 1996: 3703; 2001: 6442; 2006: 5258; 2011: 2485; 2016: 2421)
