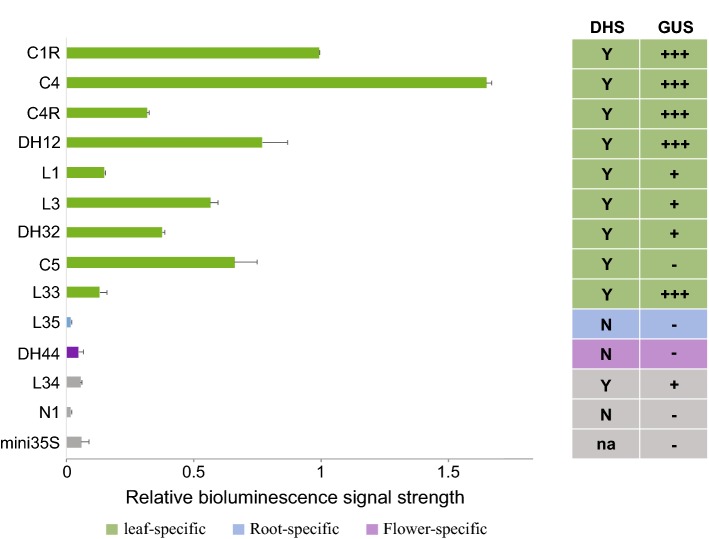
Fig. 3.
Relative signal intensity of candidate enhancers based on measurements using luciferase-based transient assays (left panel) and GUS-based transgenic assays in leaf (right panel). Left panel: Data from luciferase-based transient assays. Y-axis: 12 candidate enhancers along with two negative controls (N1 and mini35S); X-axis, relative bioluminescent signal strength normalized with enhancer C1R as standard 1. Data represent the mean ± SEM (n = 3). Right panel: Leaf data from GUS-based transgenic assays [12]. The strength of the enhancer in leaf is defined for three ordinal levels (+, ++, +++). No leaf GUS signal present as (−). DHS data associated with leaf tissue for each candidate enhancer is listed as yes (Y) or No (N). Color code for DHS: green, leaf-specific; blue, root-specific; purple, flower-specific; gray, not associated with DHS

