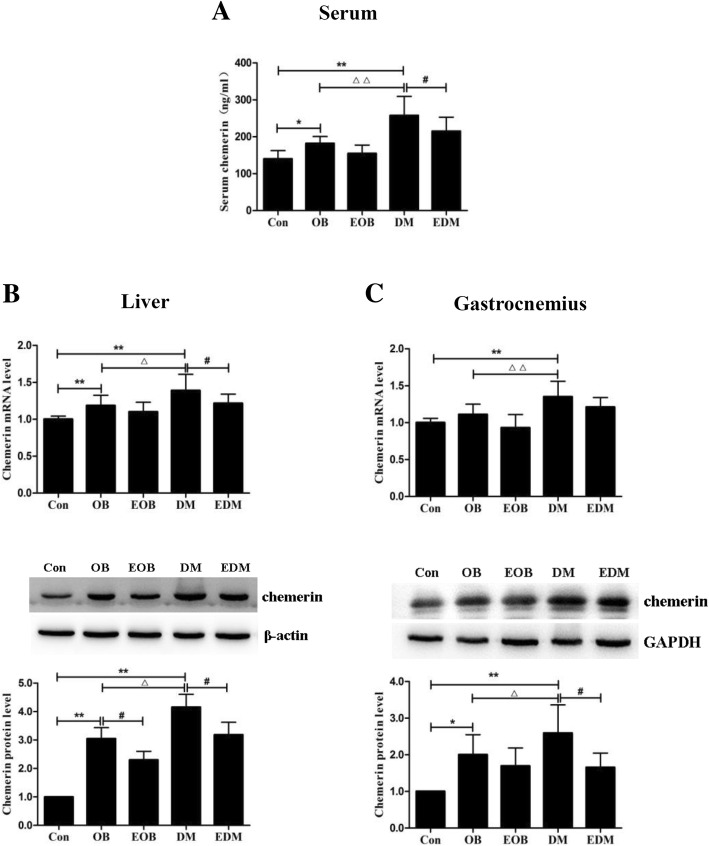
Fig. 3.
Effects of exercise on the levels of chemerin in serum (a), livers (b) and gastrocnemius (c). Serum levels of chemerin in OB and DM rats were detected by ELISA, and found a decrement of serum chemerin in DM rats rather than OB rats by exercise (a). The mRNA and protein levels of chemerin were measured by quantitative real-time PCR and Western blot, respectively. The chemerin in the livers (b) and gastrocnemius (c) of OB and DM rats were decreased at mRNA (upper) and protein (middle) levels through exercise. The blots of chemerin were quantified by Tanon software and normalized against β-actin or GAPDH, then the normalized numbers were compared between different groups (bottom). OB: obesity; EOB: exercised OB; DM: diabetes mellitus; EDM: exercised DM. *P<0.05, **P<0.01 vs Con. #P<0.05, ##P<0.01 EOB vs OB or EDM vs DM; △P<0.05, △△P<0.01 DM vs OB

