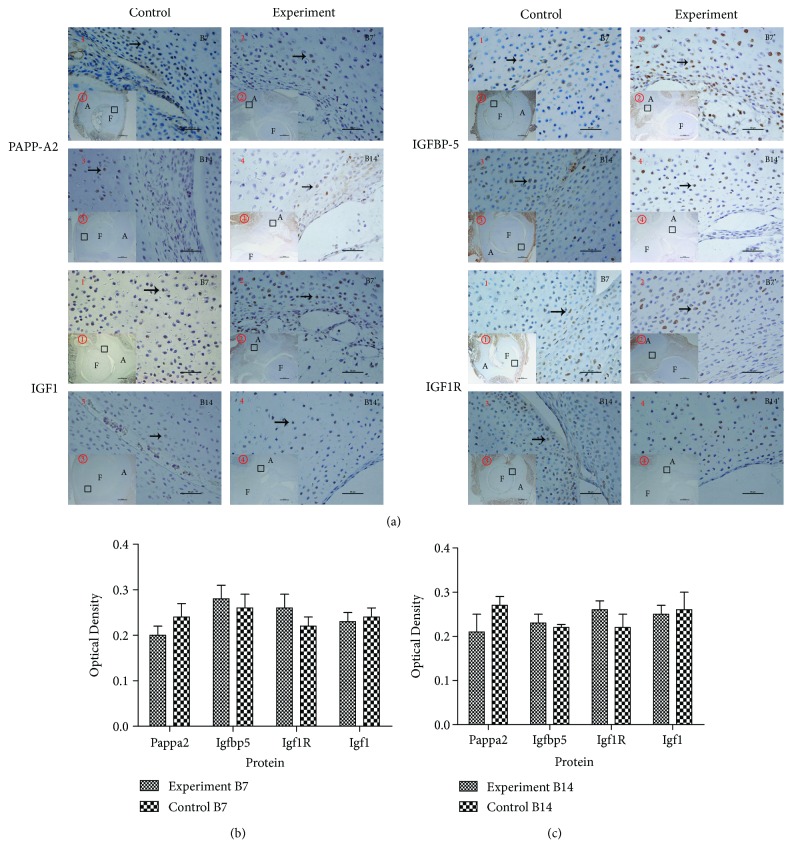
Figure 6.
Localization of PAPP-A2 and IGF pathway-associated proteins in the control group and experimental group. (a) (1, 2, 3, and 4 original magnification ×400; ①, ②, ③, and ④ original magnification ×40). The black arrow indicates positive cells. A: acetabulum; F: femoral head. B7 and B14 represent day 7 and day 14 after birth, respectively. (b) Results of PAPP-A2, IGFBP-5, IGF1R, and IGF1 at B7 (control n = 10 and experimental n = 9). (c) Results of PAPP-A2, IGFBP-5, IGF1R, and IGF1 at B14 (control n = 10, experimental n = 9).

