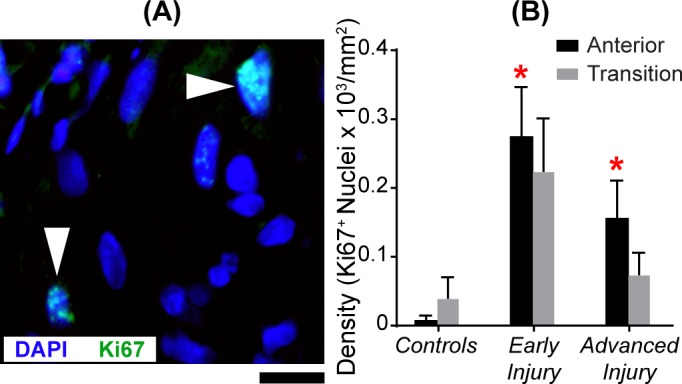
Figure 3.

Significant increase in mitotic cell density in the anterior ONH of glaucoma model eyes. (A) Image of the anterior ONH with nuclear label DAPI (blue) and mitosis label Ki67 (green). White arrowheads point to two colabeled nuclei. Scale bar: 10 μm. (B) Mean (±SEM) Ki67+ nuclear densities in the anterior (black bar) and transition (gray bar) region in controls (NAnterior = 14; NTransition = 10), early injury (NAnterior = 14; NTransition = 16), and advanced injury (NAnterior = 9; NTransition = 10) ONHs. There was a significant increase (red asterisk) in mitotic nuclei in the anterior ONH of the early injury (P = 0.0006) and advanced injury (P = 0.001) groups when compared to the controls (Table 2). There was no significant difference between anterior and transition ONH densities of mitotic cells within each group (Supplementary Table S4).
