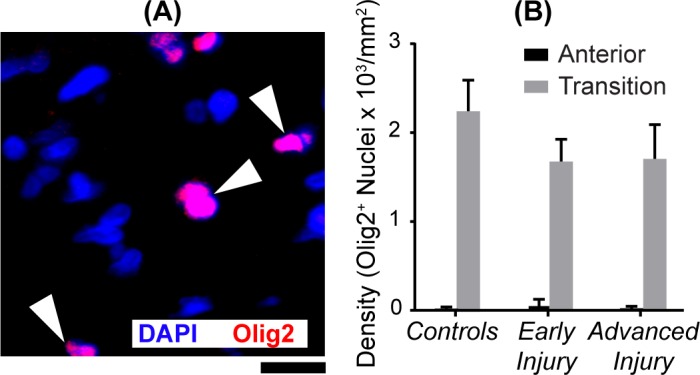
Figure 6.

Oligodendroglial densities in transition region. (A) Image of the ONH transition region immunolabeled for Olig2. White arrowheads point to three oligodendroglial nuclei (e.g., colocalization of Olig2 in red and DAPI in blue). Scale bar: 10 μm. (B) Mean (±SEM) Olig2+ nuclear densities in the transition ONH were not significantly altered by glaucomatous injury (Table 2). Sample size ranged between 6 and 11 in the anterior ONH and between 7 and 13 in the transition ONH. Negligible Olig2+ nuclei were found in the anterior regions. We found no colabeling of mitotic marker Ki67+ with Olig2+.
