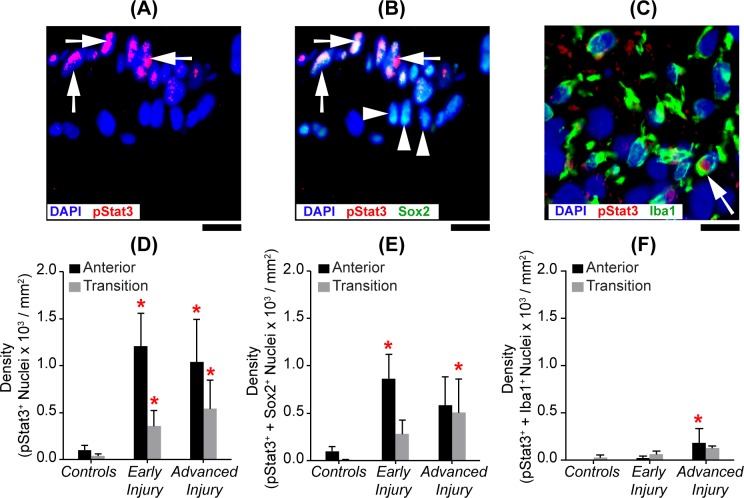
Figure 8.
Predominant localization of Jak-Stat activation with astrocytes. Images of the anterior ONH region that were immunolabeled for (A) pStat3 alone (red), (B) pStat3 (red) and Sox2 (green), or (C) the transition ONH immunolabeled for pStat3 (red) and Iba1 (green). Scale bar: 10 μm. In (B), white arrows point out several Sox2+ nuclei colabeled with pStat3+, while other Sox2+ nuclei (white arrowheads) lack pStat3 labeling. In (C), a different ONH section imaged in the transition region, and only one Iba1+ cell (white arrow) colabeled with pStat3. Mean densities of ONH nuclei colabeling by group with (D) pStat3+, (E) pStat3+, and Sox2+ and (F) pStat3+ and Iba1+ anterior (black bars) and transition (gray bars) ONH regions (mean ± SEM; sample size for controls: NAnterior = 16 and NTransition = 7; early injury: NAnterior = 19 and NTransition = 14; advanced injury NAnterior = 9 and NTransition = 9 ). Red asterisks indicate a significant difference (P < 0.05) from the respective controls.

