
Fig. 1.
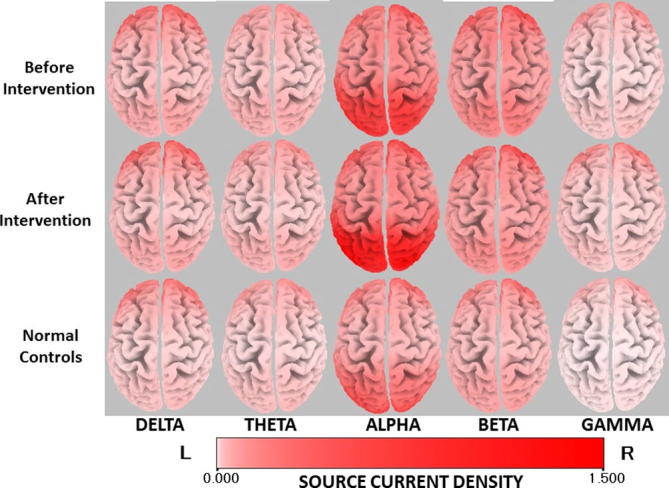
Averaged eLORETA current density in each frequency band of the participants before and after intervention, and normal controls. The red cortical area indicates the location with higher current density.
Official websites use .gov
A
.gov website belongs to an official
government organization in the United States.
Secure .gov websites use HTTPS
A lock (
) or https:// means you've safely
connected to the .gov website. Share sensitive
information only on official, secure websites.
Averaged eLORETA current density in each frequency band of the participants before and after intervention, and normal controls. The red cortical area indicates the location with higher current density.