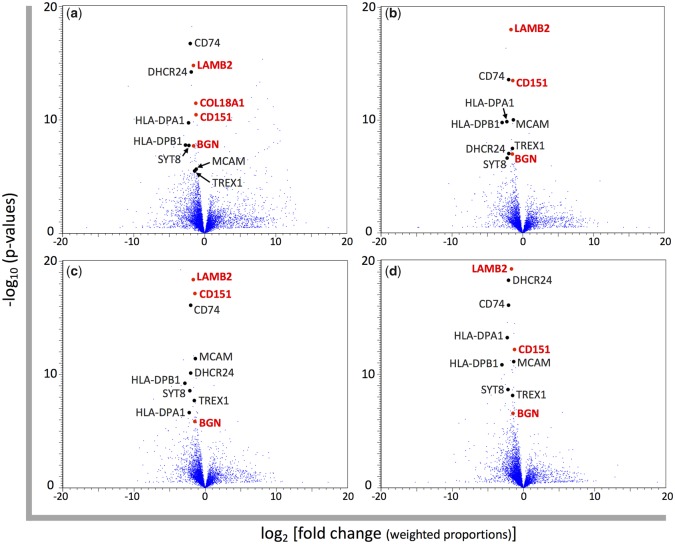
Fig. 3.
—Volcano plots for the gene expression differences between humans and nonhuman great apes. Each blue dot represents the gene expressed in the skin. The normalized RPKM values are based on the mapping to the reference genome of (a) human, (b) chimpanzee, (c) gorilla, and (d) orangutan. The log 2-fold changes of average normalized RPKM values of nonhuman great apes compared with those of humans and the −log 10 P values resulting from Baggerley’s test comparing average normalized RPKM values between humans and nonhuman great apes for each gene are plotted on the x and y axis, respectively. Differentially expressed genes between humans and nonhuman great apes selected in this study are shown by black and red dots. The gene names colored in red indicate structural protein genes.

