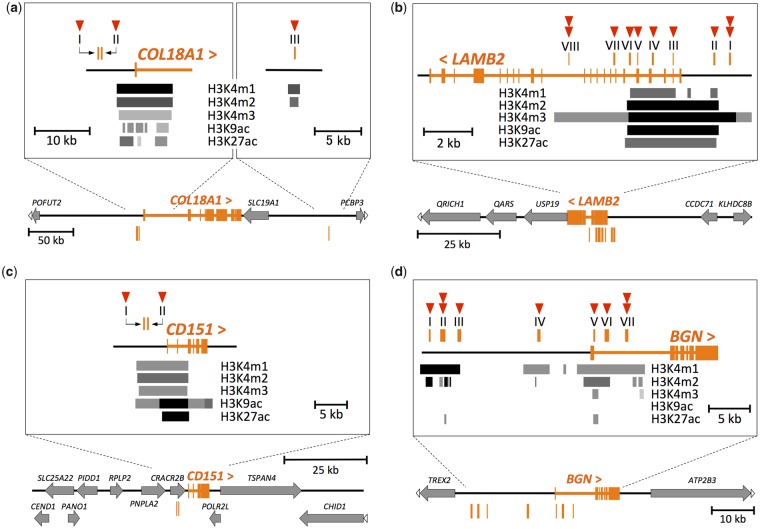
Fig. 4.
—The positions of the putative transcriptional regulatory regions with the candidate substitutions. The exons of (a) COL18A1, (b) LAMB2, (c) CD151, and (d) BGN genes are shown in orange in each panel. The symbols “<” and “>” indicate the direction of the genes. All genes (except genes of interest) are shown by gray arrows. White arrowheads at the end of horizontal lines indicate that the genes are continuous beyond the schematic representation. Orange vertical lines indicate the position of the putative transcriptional regulatory regions numbered by Roman numerals. The zoomed-in view around these regions are shown in the rectangles of each panel. H3K4m1, H3K4m2, H3K4m3, H3K9ac, and H3K27ac indicate monomethylation of histone H3 lysine 4, dimethylation of histone H3 lysine 4, trimethylation of histone H3 lysine 4, acetylation of histone H3 lysine 9, and acetylation of histone H3 lysine 27, respectively. The positions and density of the gray scale bars indicate the positions and intensity of histone modifications shown at the side of the bars, respectively. The skin cell strains referred for the histone modifications were as below: a: NHEK, b: NHDF-Ad, c: NHEK, and d: NHDF-Ad. For LAMB2 and BGN, we also referred to the NHEK strain, in which the genes are also expressed (supplementary fig. S4b and d, Supplementary Material online). The red arrowheads indicate the numbers of the candidate substitutions located in each putative transcriptional regulatory region. A substitution in COL18A1 region I was later removed from the candidate substitutions because of the high ancestral allele frequency in the locus.

