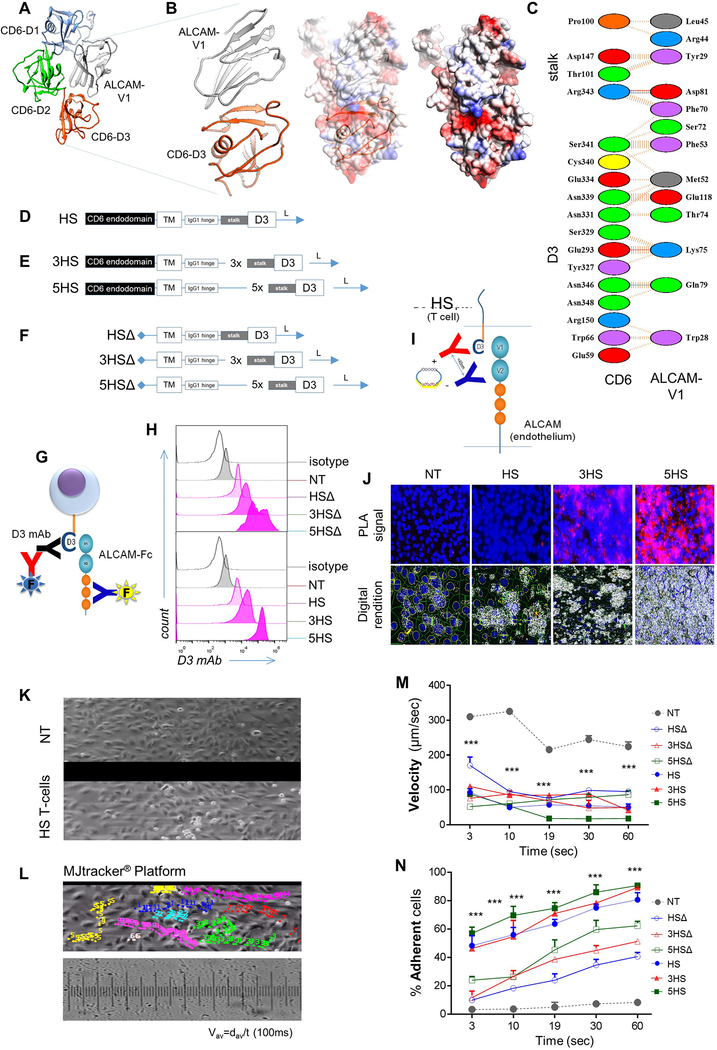
ED-Figure 3 │. In silico design of the prototype and derivative Homing System (HS) molecules, their forced-expression and detection on T-cells, and studies of their in vitro dynamic interaction with EC under shear-stress.
(A) The potential interaction between ALCAM V1 (grey ribbon) and CD6 from computational docking. D1 of CD6 is colored blue, D2 is colored green and D3 is colored orange. (B) Details of the potential interaction interface between ALCAM V1 (grey ribbon) and CD6 D3 (orange ribbon) is shown. A rendering of the electrostatic surface of the ALCAM V1 (grey ribbon) with the D3 domain of CD6 (orange ribbon) in the same orientation. Potential interacting residues are highlighted in the models and (C) in a diagram generated from PDBe PISA and PDBSum. A small region of positively-charged residues in ALCAM V1 appears to interact with a negatively-charged patch of residues on CD6 D3. (D) Structure of the prototype HS-molecule. (E) HS-multimers 3HS and 5HS. (F) HS molecules with non-signaling endodomains, HSΔ, 3HSΔ and 5HSΔ. (G) Cartoon depicting the strategy used for surface detection of the HS-exodomain using a D3-specific antibody and specific binding of HS-exodomain to soluble ALCAM. (H) Flow-cytometry confirming HS surface expression (D3 mAB) on T-cells. (I) Cartoon depicting the design of the HS/ALCAM PLA experiment and (J) the digital rendition using ImageTool®. The ALCAM probe (–) binds to the D3 probe (+) to trigger the polymerase chain (PCR) reaction generating the red fluorescent signal that is quantified as total signal per region (TSR) in Fig. 2F. (K and L) Dynamic microfluidic studies showing (K) still image from the Supplementary Video 1 of Bioflux® channels with non-transduced control (NT) T-cells (top) vs. 1×10⁶ HS T-cells interrogated under shear force over an ALCAM-expressing endothelium and (L) still image from MJtracker® demonstrating various T-cells under interrogation for various TEM dynamic measures, the standard grid used and the equation used for calculations (bottom). (M) Dynamic adhesion of T-cells to EC per field of view and (N) average dynamic rolling velocity against time; *p<0.05, **p<0.01, ***p <0.001. Two way ANOVA then Tukey for multiple-comparisons (compared to NT).

