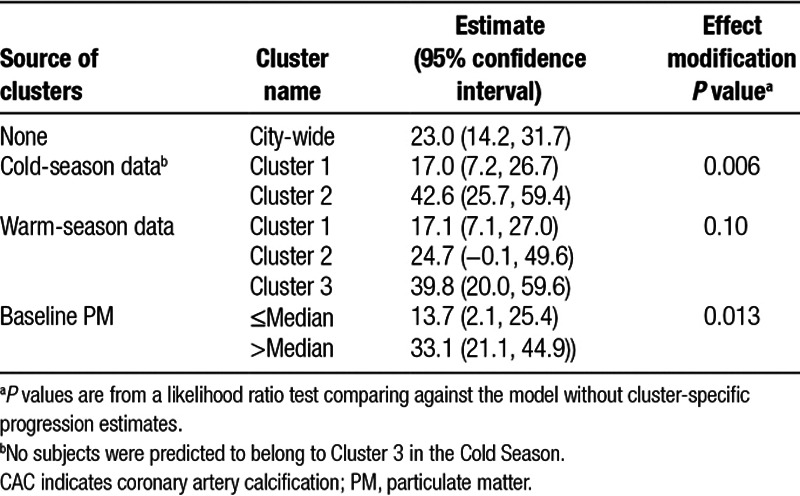
Table 4.
Cluster-specific estimates of the association between CAC progression, in Agatston units per year, and differences of 5 μg/m3 PM2.5

Cluster-specific estimates of the association between CAC progression, in Agatston units per year, and differences of 5 μg/m3 PM2.5
