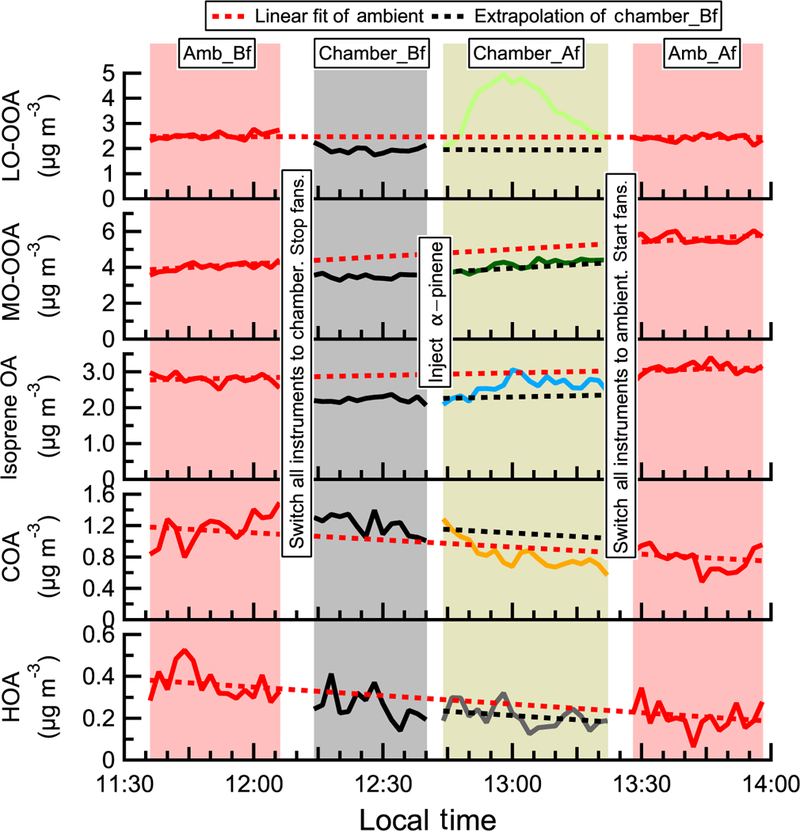
Figure 3.

The time series of OA factors in an α-pinene perturbation experiment (expt. ID: ap_0801_1). Each perturbation experiment includes four periods: Amb_Bf (~ 30min), Chamber_Bf (~ 30min), Chamber_Af (~ 40min), and Amb_Af (~ 40min). “Amb” and “Chamber” represent the fact that instruments are sampling ambient and chamber, respectively. “Bf” and “Af” stand for before and after perturbation, respectively. The solid lines are measurement data. The dashed red lines are the linear fits of ambient data (i.e., combined Amb_Bf and Amb_Af). The slopes are used to extrapolate Chamber_Bf data to the Chamber_Af period (i.e., dashed black lines). The validity of the linearity assumption is discussed in Appendix A. The difference between measurements (i.e., solid lines) and extrapolated Chamber_Bf (i.e., dashed black lines) represents the change caused by perturbation.
