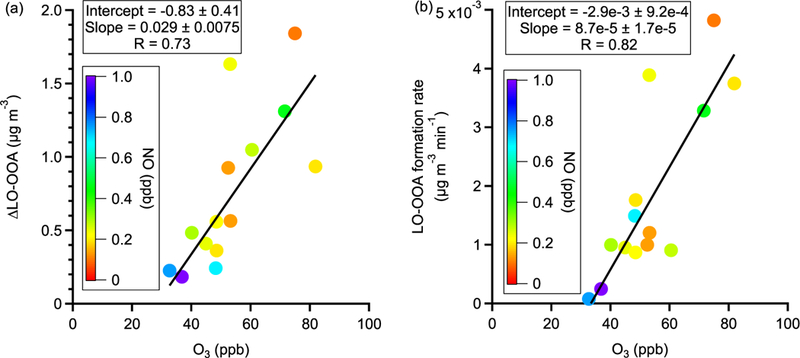
Figure 5.

Observations of trends in (a) LO-OOA enhancement amount and (b) LO-OOA formation rate with O3 concentration in α-pinene perturbation experiments. The data points are colored by average NO concentration during the Chamber_Af period. The slopes, intercepts, and correlation coefficients (R) are obtained by a least squares fit.
