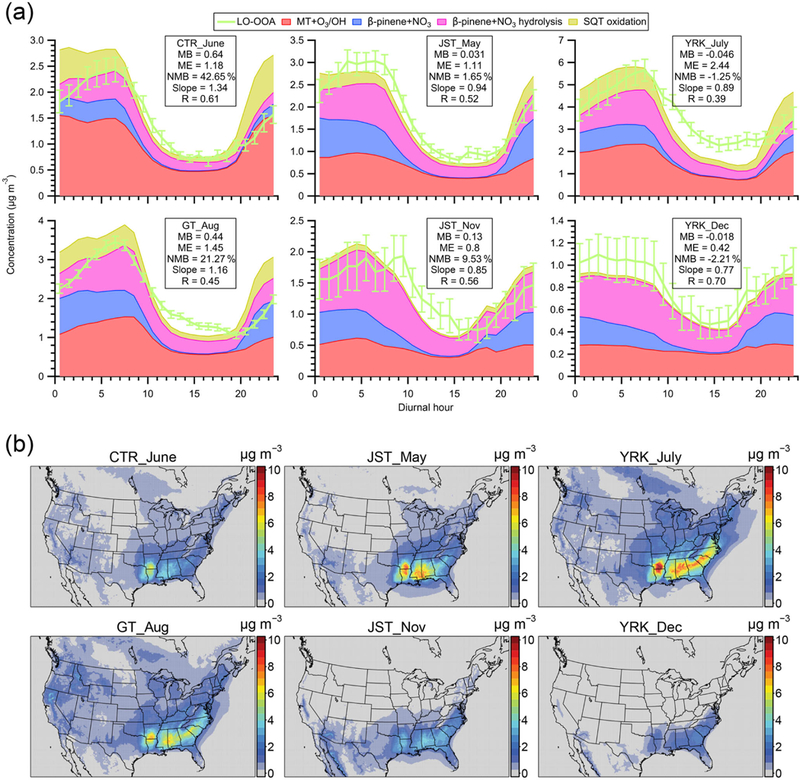
Figure 6.

(a) The diurnal trends of LO-OOA and modeled SOA from monoterpenes and sesquiterpenes (SOAMT+SQt) at different sampling sites in the southeastern US. (b) Maps of the modeled ground-level SOAMT+SQT concentration coinciding with the time periods of intensive ambient sampling. Model results shown here are from the updated simulation. Abbreviations correspond to Centreville (CTR), Jefferson Street (JST), Yorkville (YRK), and Georgia Institute of Technology (GT). Detailed sampling periods are shown in Table S1. In panel (a), since the perturbation experiments show that 16 % of SOA from α-pinene oxidation is apportioned into isoprene OA (Fig. S5a), we only include 84 % of modeled SOA from MT + O3 / OH when comparing with LO-OOA for the sites with isoprene-OA. The mean bias (MB), mean error (ME), and normalized mean bias (NMB) for each site are shown in each panel. The slopes and correlation coefficients (R) are obtained by a least squares fit. The error bars indicate the standard error. In panel (b), the average SOAMT+SQT concentration in PM2.5 during each sampling period is reported.
