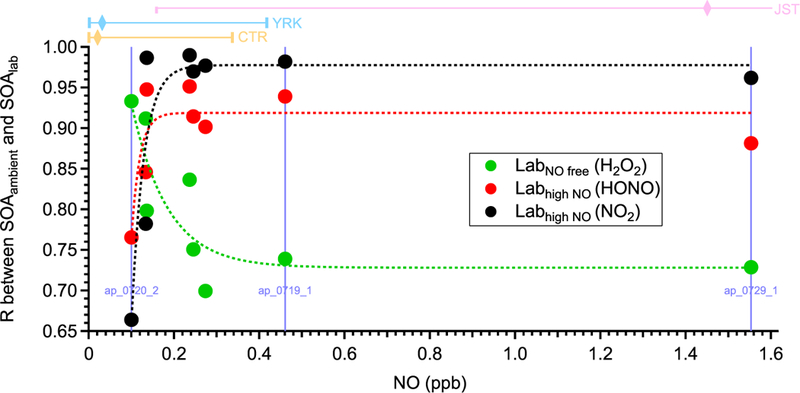
Figure 7.

The correlation coefficients between the mass spectra of OA formed in the laboratory under different NO conditions (SOAlab) and those of OA formed in ambient a-pinene perturbation experiments (SOAambient). The subscripts lab and ambient indicate the SOA formed under laboratory conditions and ambient conditions, respectively. Three different oxidant sources (i.e., H2O2, HONO, and NO2) are used to create different NO concentrations in laboratory studies. The mass spectra of SOAambient are calculated by comparing the mass spectra of OA during Chamber_Af and those of extrapolated Chamber_Bf (Sect. S7 of the Supplement). To calculate reliable mass spectra of SOAambient, only the experiments with significant OA enhancement are analyzed and shown here (Appendix A). The x axis is the average NO concentration during each perturbation experiment. The data points on the same vertical line (i.e., the same NO concentration) are from the same perturbation experiment, but compared to three different laboratory experiments. The dashed lines are used to guide the eyes. The bars on top of the figure represent the 10th, 50th, and 90th percentiles of NO concentration for CTR (Centreville, AL), YRK (Yorkville, GA), and JST (Jefferson Street, GA) in 2013. The NO concentration is measured by the Southeastern Aerosol Research and Characterization (SEARCH) network. The 90th percentile of NO concentration in JST is 14.8 ppb, which is not shown in the figure.
