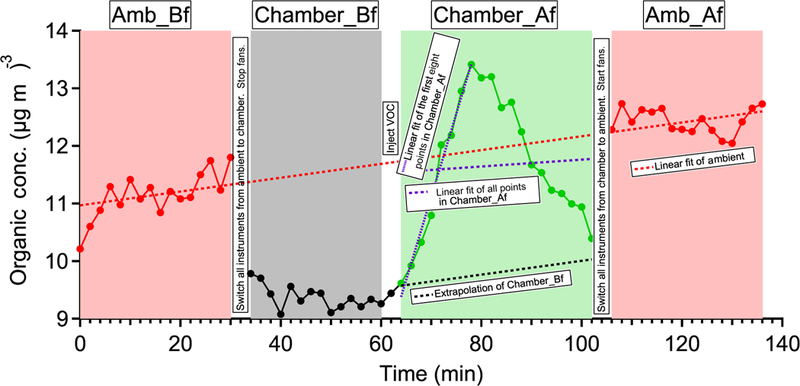
Figure A1.

Time series of OA in experiment ap_0801_1 to illustrate the analysis method. Each perturbation experiment includes four periods: Amb_Bf (~ 30 min), Chamber_Bf (~ 30 min), Chamber_Af (~ 40 min), and Amb_Af (~ 40 min). “Amb” and “Chamber” correspond to the periods when the instruments are sampling ambient and chamber, respectively. “Bf” and “Af” stand for before and after perturbation, respectively. The solid lines are measurement data. The dashed red lines are the linear fit of ambient data (i.e., combined Amb_Bf and Amb_Af). The slope is used to extrapolate Chamber_Bf data to the Chamber_Af period (i.e., black dashed line). The dense dashed purple line is the linear fit of the first eight points during the Chamber_Af period. The sparse dashed purple line is the linear fit of all data points during the Chamber_Af period. During this period, the difference between measurements (i.e., solid green data points) and extrapolated Chamber_Bf (i.e., dashed black line) represents the change in organic concentration caused by perturbation.
