
Figure 1. FIGURE 1: Evaluation of Genome-wide expression cliques.
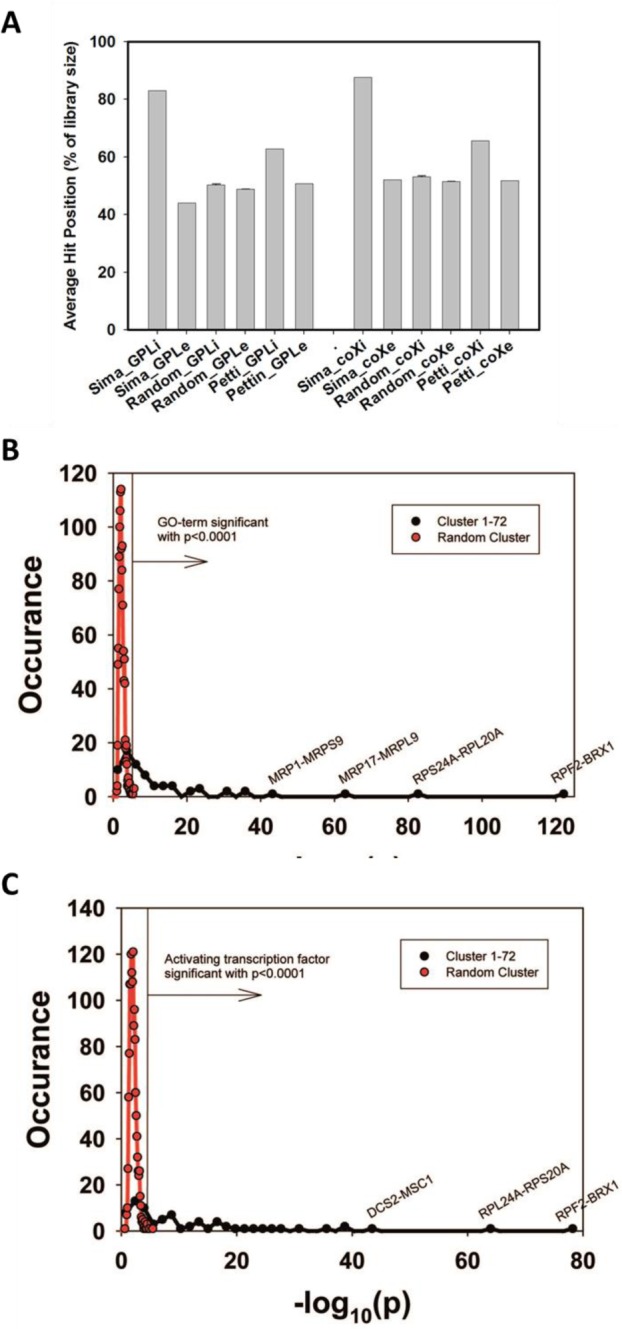
(A) Comparison between our clique set, random genes and the clique set from Petti et al. The comparison is based either on our own coexpression database (left side) or on the co-expression database from COXPRESdb (right side). (B) GO-term assignments for the 72 identified cliques or for random cliques. The significance threshold for p<0.0001 is indicated as vertical line in the figure. As comparison to the calculated cliques (red plot) random gene cliques were used (black plot). (C) Assignment of activating TFs for the identified 72 cliques or for random cliques based on the YEASTRACT database. The significance threshold for p<0.0001 is indicated as vertical line in the figure.