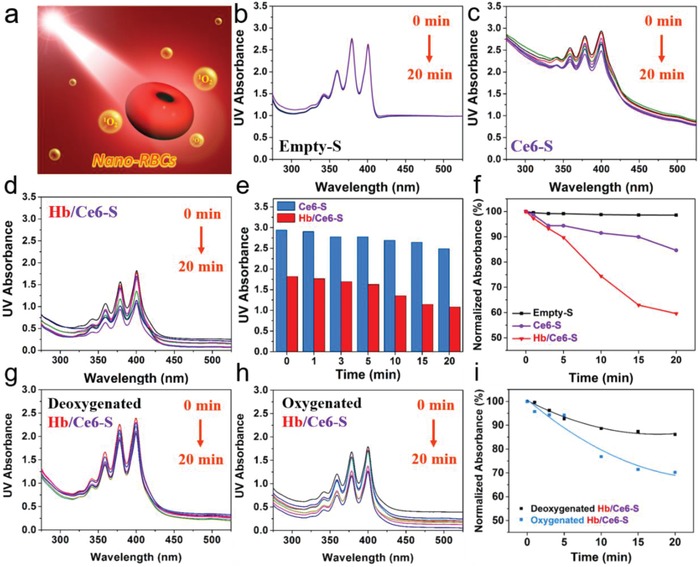
Figure 2.

Evaluation of singlet oxygen generation. a) Schematic illustration of the detection of 1O2 by measuring the changes in UV–vis spectra upon oxidation of ABDA under 660 nm laser irradiation. The time‐lapsed absorption spectra of ABDA in the presence of b) Empty‐S, c) Ce6‐S, and d) Hb/Ce6‐S. All stomatocytes are coated with an erythrocyte cell membrane. e) Difference in ABDA oxidation as a function of time between Ce6‐S and Hb/Ce6‐S. f) Normalized absorbance changes, including a negative control (Empty‐S) and Ce6‐S, together with Hb/Ce6‐S. Absorbance spectra of ABDA in the presence of g) deoxygenated Hb/Ce6‐S, h) oxygenated Hb/Ce6‐S, and i) normalized absorbance spectra.
