
Figure 5.
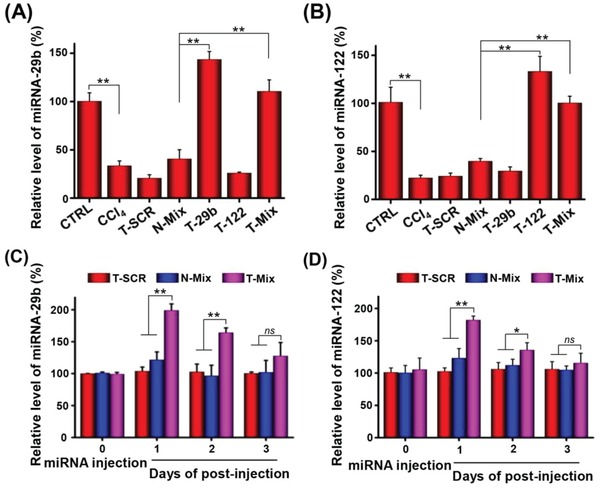
Content and time duration of the miRNA in CCl4‐induced liver fibrotic rats with/without extrinsic miRNA administration as determined by RT‐PCR. Relative levels of A) miRNA‐29b and B) miRNA‐122 in livers at 24 h after i.v. administration of different nanoplexes. Content of C) miRNA‐29b and D) miRNA‐122 at 1, 2, and 3 d after i.v. injection of different nanoplexes. The dose of miRNA‐29b and miRNA‐122 was 1 mg kg−1 body weight. Data are shown as mean ± SD, n = 3. *P < 0.05 and **P < 0.01. Abbreviations: N‐Mix, PBP micelle complexing miRNA‐29b and miRNA‐122; T‐Mix, T‐PBP micelle complexing miRNA‐29b and miRNA‐122.