
Figure 7.
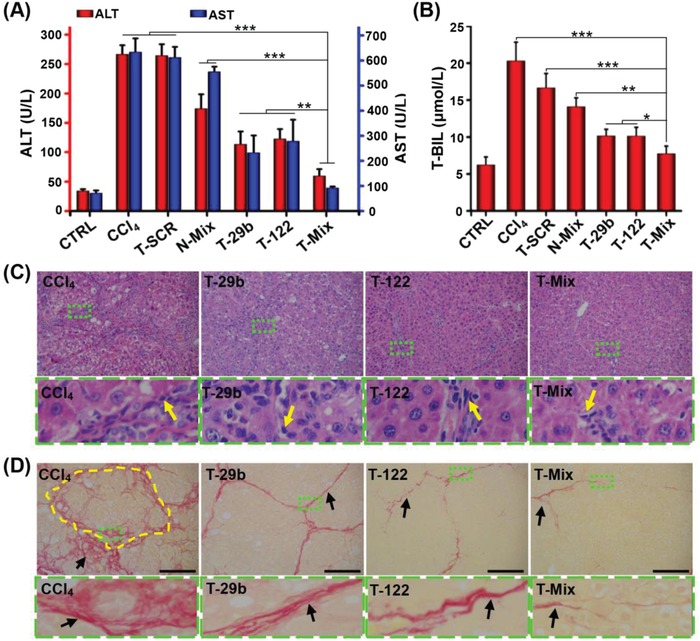
In vivo synergistic antifibrotic effect of miRNA‐29b and miRNA‐122. Effect of various miRNA treatments on A) serum ALT and AST levels and B) T‐BIL levels. Data are shown as mean ± SD, n = 3. *P < 0.05, **P < 0.01, and ***P < 0.001. C) H&E and D) Sirius red staining of liver specimen of CCl4‐induced rats after i.v. administration of various nanoplexes. The areas marked with dotted green rectangle are enlarged to reveal the changes of pathological structure. The yellow arrows indicate the inflammatory cells, and the yellow dotted portion indicates the pseudolobule in liver. The black arrows mark the collagen fiber. Scale bars represent 100 µm.