
Figure 1.
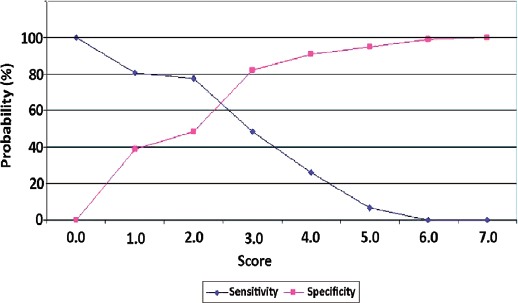
Sensitivity and specificity curves. Sensitivity and specificity curves were used to determine the optimal cut-off value. There were 2 alternative points of intersection: a score of 2 (sensitivity 77.4%, specificity 48.4%) and a score of 3 (48.4% sensitivity, 82.3% specificity).