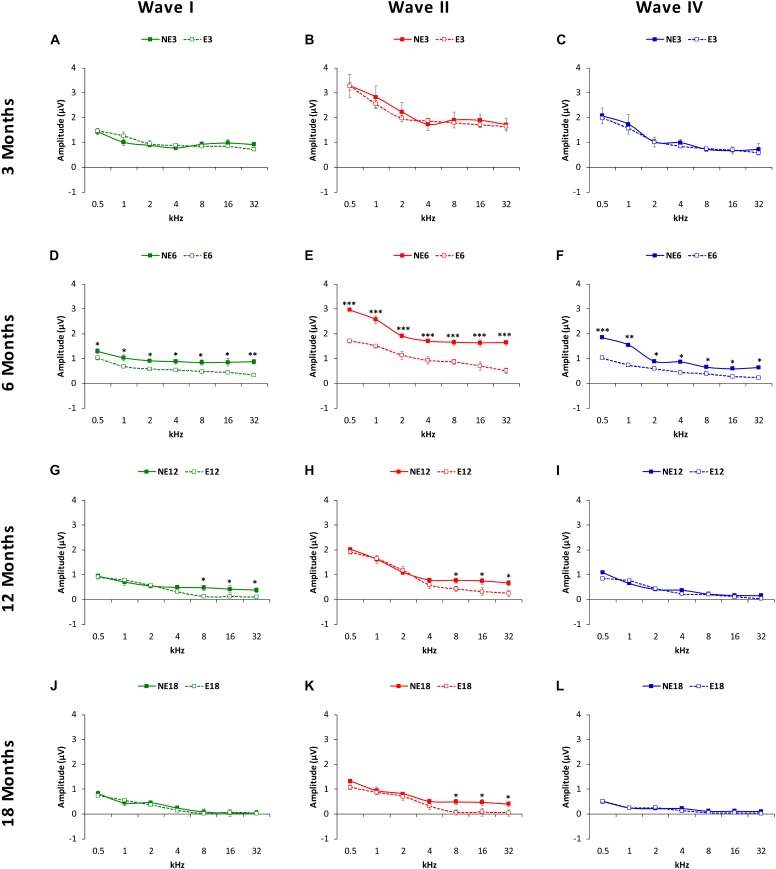
FIGURE 4.
Line graphs illustrating wave amplitudes (in μV), as a function of the frequencies evaluated in NE (solid lines) and E (dashed lines) animals at 3, 6, 8, and 18 months of age. At 3 months (A–C), previous any noise exposure, the mean values of waves I, II and IV (the largest in the ABRs) were similar in both groups, while in 6-month-old rats (D–F), the mean amplitudes of all waves in the exposed animals at all frequencies were significantly reduced when compared to non-exposed rats. At 12 months (G–I), while there was a decrease in the mean amplitudes of all waves in both exposed and non-exposed rats, waves I (G) and II (H) at the highest frequencies (H) in the E group were still smaller than those observed in NE animals. No differences were observed in wave IV (I). At 18 months, whereas no differences were observed between groups in the waves I (J) and IV (L), the mean values in wave II in the E group remained reduced at the highest frequencies (K). ∗p < 0.05, ∗∗p < 0.01, ∗∗∗p < 0.001.

