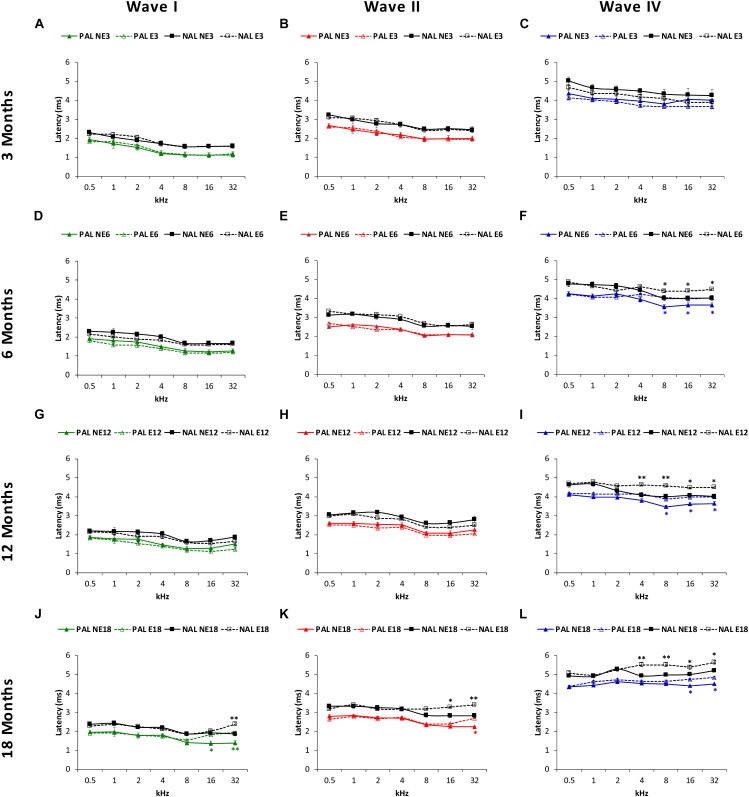
FIGURE 6.
Line graphs depicting the absolute positive (colored lines) and negative (black lines) latency times (ms) of waves I, II, and IV, as a function of frequency in NE and E rats. At 3 months (A–C) in both NE and E animals, previous any noise exposure, the mean values for the absolute latencies in waves I, II, and IV were similar to those previously reported. At 6 and 12 months in the exposed rats these values were significantly longer at the highest frequencies for wave IV (F,I), but not for wave I (D,G) or II (E,H). In 18-month-old rats, a significant lengthening of latency times was detected in the exposed animals for waves I (J), II (K), and IV (L) also at the highest frequencies. PAL, Positive Absolute Latencies; NAL, Negative Absolute Latencies, ∗p < 0.05, ∗∗p < 0.01.

