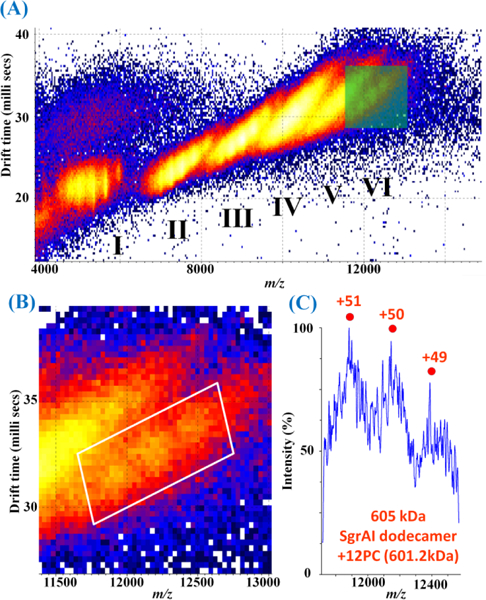
Figure 2.

Mobiligram of SgrAI dimer:PC DNA at a molar ratio of 1:2. (A) Six distinct regions are visible (I-VI). Regions I-III correspond to SgrAI dimer+2PC DNA, SgrAI tetramer+4PC DNA, and SgrAI hexamer+6PC DNA, respectively. Regions IV-VI overlap in the mass spectrum (Figure 1C) but are distinct regions separated by drift time in IMS. (B) Enlargement of the green boxed region in (A). (C) Spectrum extracted from the region in the white boxed region in (B) with peaks corresponding to SgrAI dodecamer+12PC DNA. These peaks are resolvable only after IMS which separates species that otherwise overlap in the mass spectrum.
