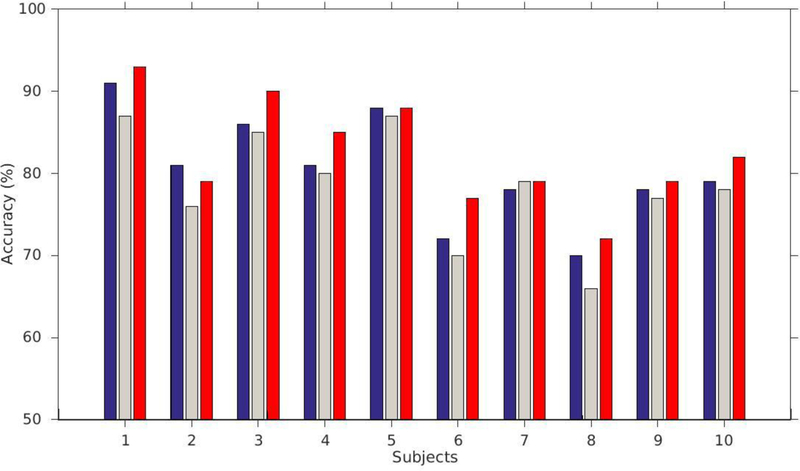
Fig. 9.
Mean accuracy (percent correct) for each subject for each position of the stimulus matching the probe stimulus of the Sternberg task. Blue bars correspond to the case when the matching stimulus was first, gray when it was second and red when it was third. Nine of the 10 subjects had more errors for the second position than for the other two, and nine subjects had their highest accuracy for the third position (recency effect).

