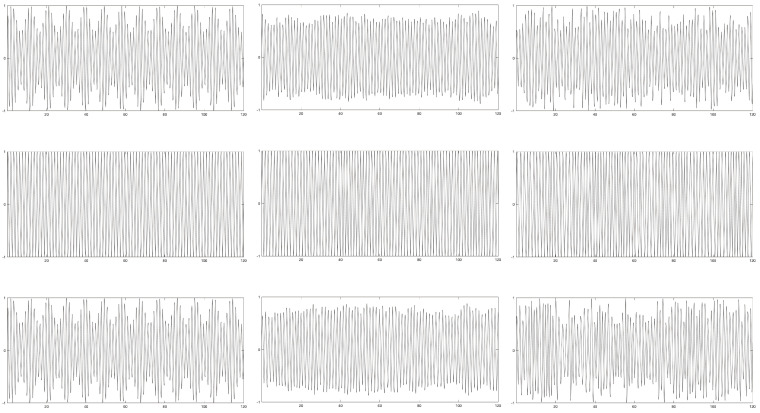
Figure 2.
A 120-second segment of generated continuous data for periodic (left), chaotic (middle), and random (bottom) for amplitude (top), period (middle), and period + amplitude (bottom) manipulations. Discrete signals (Figure 3) were generated by subtracting peaks from valleys as denoted by x’s on each graph.

