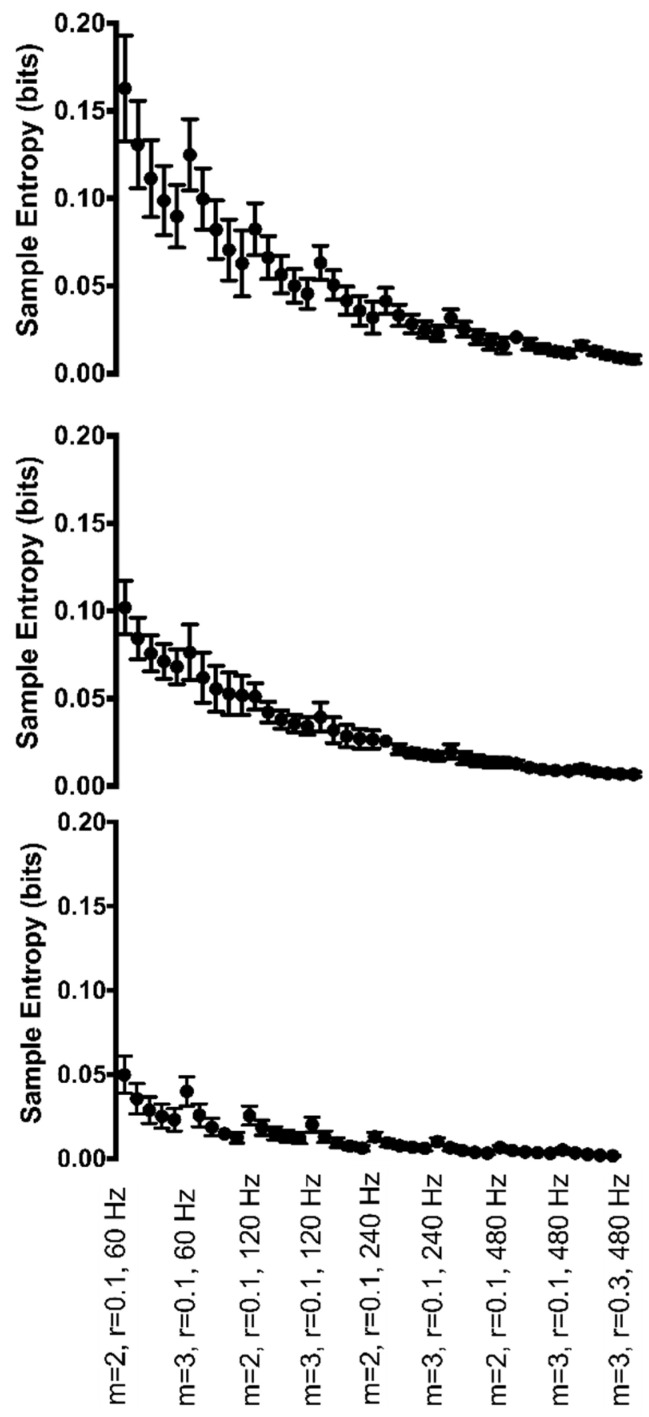
Figure 5.
Group mean sample entropy of ankle joint angle (top row), knee joint angle (middle row), and hip joint angle (bottom row) for each Hz*r*m parameter combination. Sample entropy values are displayed on the y-axis. All parameter combinations are plotted along the x-axis starting with m = 2, r = 0.10, and 60 Hz at the left and moving to m = 3, r = 0.30, and 480 Hz at the right. For clarity, only the combination with r = 0.10 is labeled for each combination of m and sampling rate, with the r value increasing with each data point within each combination.

