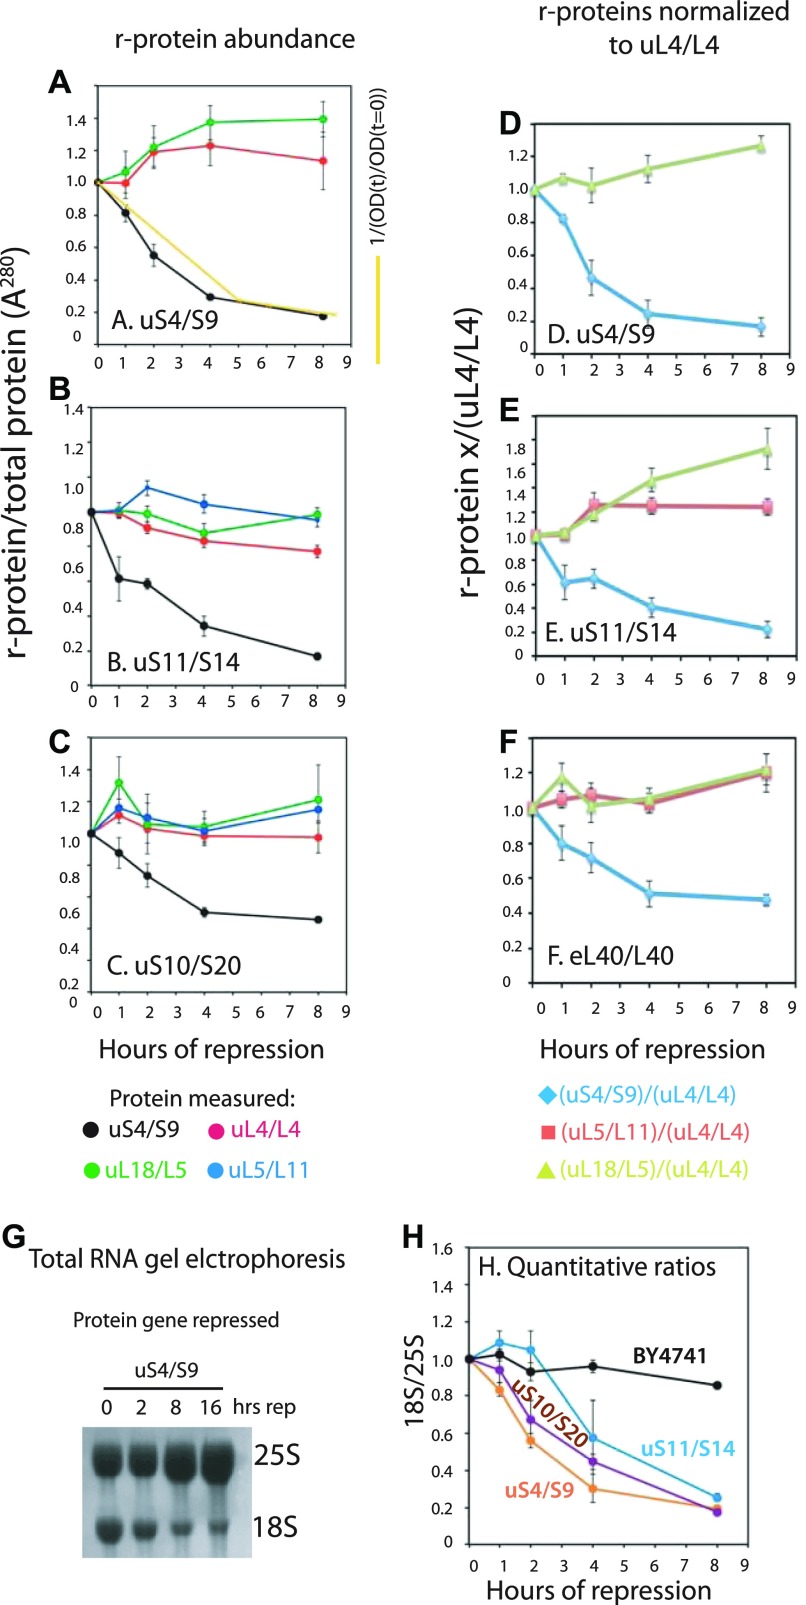
Figure 5. Quantification of ribosomal components from both subunits do not covary after repression of genes for 40S r-proteins.
Cultures of Pgal-uS4, Pgal-uS11, and Pgal-uS10 were grown in YEP-galactose and shifted to YPD. The control experiment with BY4741 is shown in Fig 3A and E. (A–C) Aliquots were harvested at 0, 1, 2, 4, and 8 h and equal A280 units from each sample were analyzed by Western blots probed with antisera for uS4, uL4, uL5, and uL18. The intensities of the Western bands were quantified using ImageJ. The yellow curve in panel A indicates the dilution curve calculated from the growth curve after repressing uS4 synthesis. (D–F) Data from A–C were normalized to the values for uL4. (G, H) Ratio between 18S and 25S rRNA. Total RNA was purified using RiboPure (G) or hot phenol extraction (H). Equal A260 units of each sample (0.06 corresponding to ∼3 μg) were applied to agarose gels. (G) Bands were blotted to a membrane and stained with methylene blue. (H) Gel was stained with ethidium bromide, photographed on a gel imaging system, and quantified with ImageJ. Images of the Western blots are shown in Fig S3. Fig S4 shows images of the ethidium bromide stained gels.
Source data are available for this figure.

