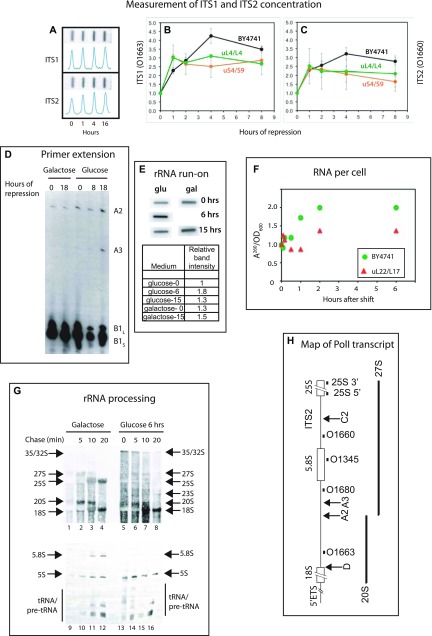
Figure 6. Transcription and maturation of rRNA after repression of 40S and 60S r-protein synthesis.
(A–C, F) The control strain BY4741 and strains in which the indicated proteins were expressed from the galactose promoter were grown in YEP-galactose (A–C, F) or synthetic complete galactose medium lacking uracil (panels D, E, and G). At time 0, the cultures were shifted to glucose medium for the indicated time. (A–C) Measurement of the sum of transcripts containing ITS1 and ITS2. Total RNA from BY4741, Pgal-uL4, and Pgal-uS4 was purified, and equal A260 units were loaded onto a nylon membrane in a slot format (A). The membrane was probed with ITS1 oligonucleotide O1663 (B) or ITS2 oligonucleotide O1660 (C); see panel H for the position of the sequences to which they hybridize. (D) Analysis of 5′ ends at sites A2 and A3 in rRNA processing intermediates. 32P end-labeled primer O1345 (panel G) was hybridized to equal amounts of total RNA from Pgal-uL4 (YLL2083) and extended to 5′ ends of processing intermediates generated by cleavage A2 and A3 (see panel H). (E) Run-on analysis of rRNA transcription during repression of uL4 synthesis. Aliquots of cultures of Pgal-uL4 (YLL2083) growing in synthetic medium were harvested at the indicated times after the shift to glucose medium. Equal A260 units from each sample were used for run-on labeling with α-32ATP. The products were hybridized to slot blots of pDK16 carrying the 35S rRNA transcription unit (Lindahl et al, 1994). (F) Yield of A260 material per OD600 units of culture harvested. Equal OD600 units of Pgal-uL22 and BY4741 were harvested at the indicated times. Total RNA was prepared by the hot phenol method and the A260 of the final preparation was measured and normalized to time 0. (G) Pulse-chase analysis of rRNA processing during repression of uL4 synthesis. Pgal-uL4 (YLL2083) was grown in synthetic medium and harvested 0 or 6 h after the shift to glucose medium. The cells were labeled with 3H-uracil for 2 min and then incubated (chased) with a large excess of nonradioactive uracil for the indicated times. RNA was extracted and equal amounts of radioactivity from each sample were then fractionated by agarose gel electrophoresis, transferred to a membrane, and visualized by fluorography. (H) Map of the yeast Pol I rRNA transcription unit. The black boxes immediately below the map show the positions of the oligonucleotide probes used. The arrows labeled D, A2, A3, and C2 indicate cleavage sites relevant for this study. Other processing sites are omitted. The major rRNA processing intermediates (20S and 27S) are indicated below the map. For more details on rRNA processing, see Woolford & Baserga (2013).
Source data are available for this figure.

