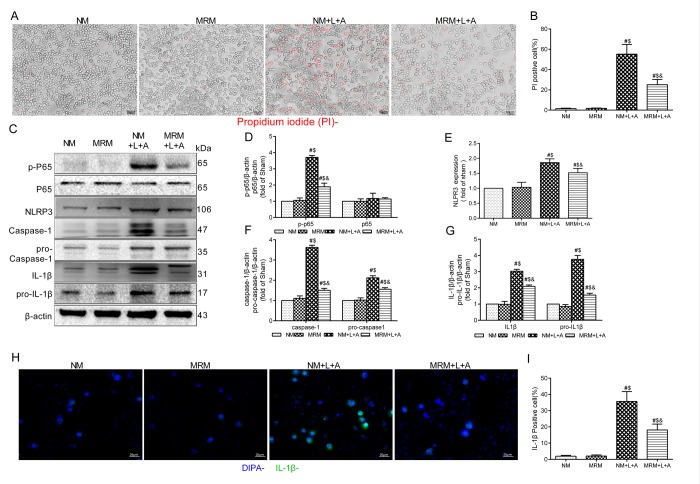
Figure 7. Methane restrained pyroptosis in vitro. (A) Representative propidium iodide (PI) staining of RAW 264.7 cells (Scale bars: 25μm). (B) The percentage of PI positive cells. (C) Representative immunoblots of p65, p-p65, pro-caspase1, pro-IL-1β and NLRP3/Caspase-1/IL-1βfrom RAW264.7 cells. (D) Relative densities of p-P65 and P65, (E) NLRP3, (F) caspase-1 and pro-Caspase-1, and (G) IL-1β and pro-IL-1β were calculated. (H) Representative immunofluorescence staining of IL-1β (Scale bars: 25μm). (I) The percentage of IL-1β positive cells was calculated. (n = 3. Data are shown as the mean ±SD. #P < 0.05 versus NM (normal medium) group; $p < 0.05 versus MRM (methane-rich medium) group; &P < 0.05 versus. NM+L+A (normal medium+ lipopolysaccharide+ adenosine-triphosphate) group).

An official website of the United States government
Here's how you know
Official websites use .gov
A
.gov website belongs to an official
government organization in the United States.
Secure .gov websites use HTTPS
A lock (
) or https:// means you've safely
connected to the .gov website. Share sensitive
information only on official, secure websites.
