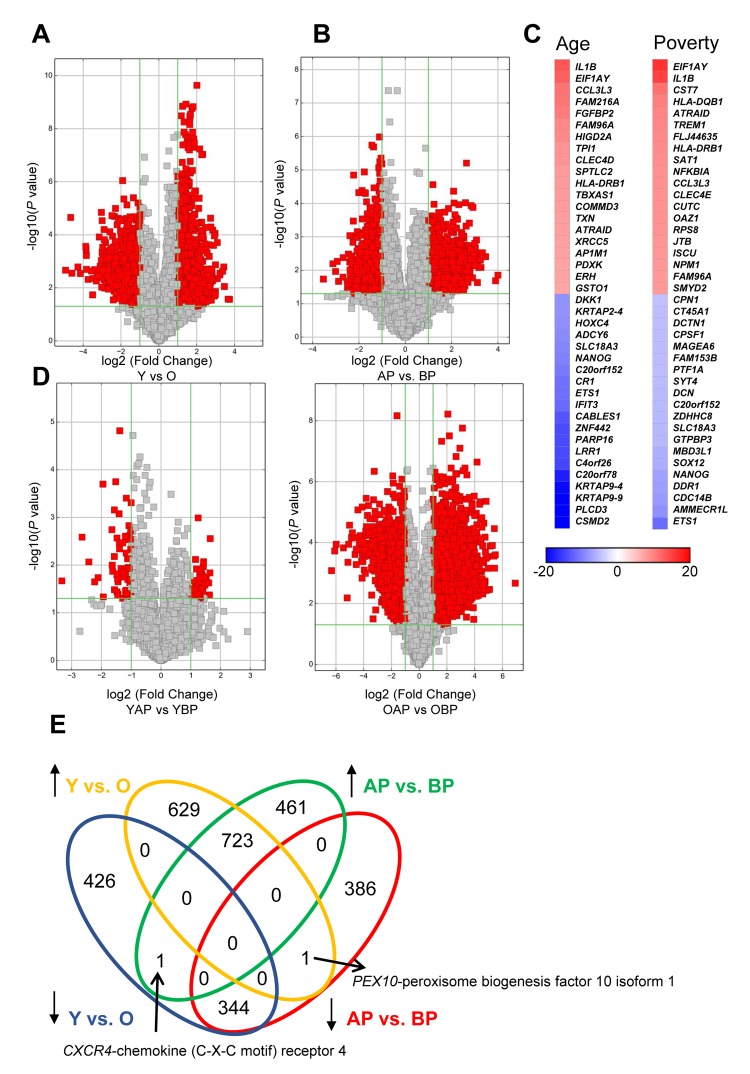
Figure 4.
Changes in mRNA expression levels with age and poverty. The levels of expressed mRNAs in white young and old males (A) living above or below poverty (B) were assessed using microarrays. Volcano plots show log2 fold change and P value for each mRNA. Red indicates mRNAs that changed were >2-fold, with P<0.05. (A,B,D) Comparisons of significantly different mRNAs between groups are indicated. (C) Heat maps indicate the top fold changed mRNAs with age and poverty. These mRNAs are also listed in Tables 4 and 5. (E) Venn diagram of the total number of significantly increased or decreased mRNAs for each comparison. Y, young; O, old, AP, above poverty; BP, below poverty

