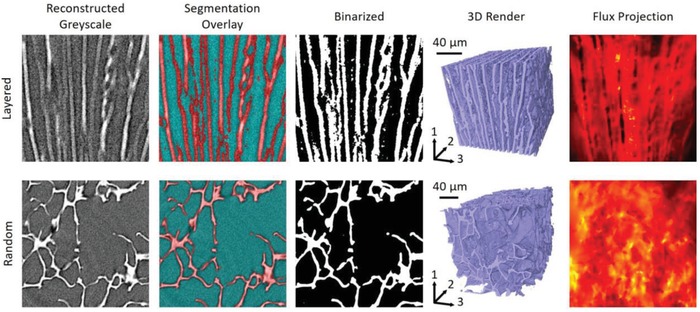
Figure 3.

The imaging and simulation pipeline for the two samples, showing the reconstructed grayscale images from the XCT; the same images, overlaid with the trained Weka segmentation results; the same images, now converted to binary format; the full segmented 3D volume (showing scale and directional labeling); and, finally, sample simulation results highlighting the projected flux density resulting from the diffusion simulation, where the bright regions represent higher flux.
