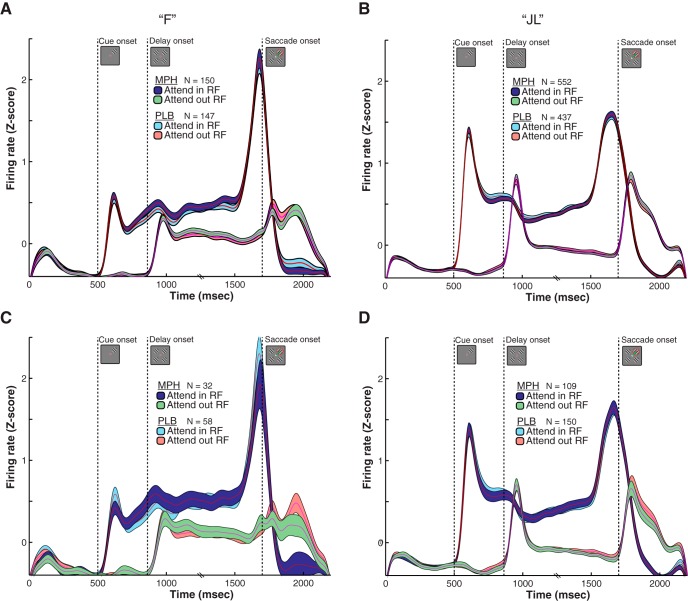
Figure 3.
Qualitative effects of MPH on the average single neuron response. A, Attentional modulation of single neuron activity averaged over the entire sample of tuned cells and trials (sample size reported with N in figure). The trial-averaged SDFs are displayed separately for MPH and placebo (PLB) sessions. The light blue and red SDFs depict the average single neuron response on trials where attention is allocated inside, or opposite to the neuron’s preferred location (i.e., RF), respectively. The abscissa represents the time from trial onset and the ordinate the population neuronal firing rate (z-scored). Shaded areas represent SEM. The average responses during all MPH sessions are overlaid on top of the average response during placebo sessions to illustrate the near-perfect overlap in single neuron responses across treatment conditions. B, Same as in A but for monkey “JL.” C, D, Same as A, B but only including the MPH sessions showing the best behavioral improvement due to treatment (best-dose analysis; 0.86 mg/kg for monkey “F,” 0.67 mg/kg for monkey “JL”). The same absence of difference in this best-dose analysis is demonstrated by the overlap of the MPH and PLB curves in C, D.

