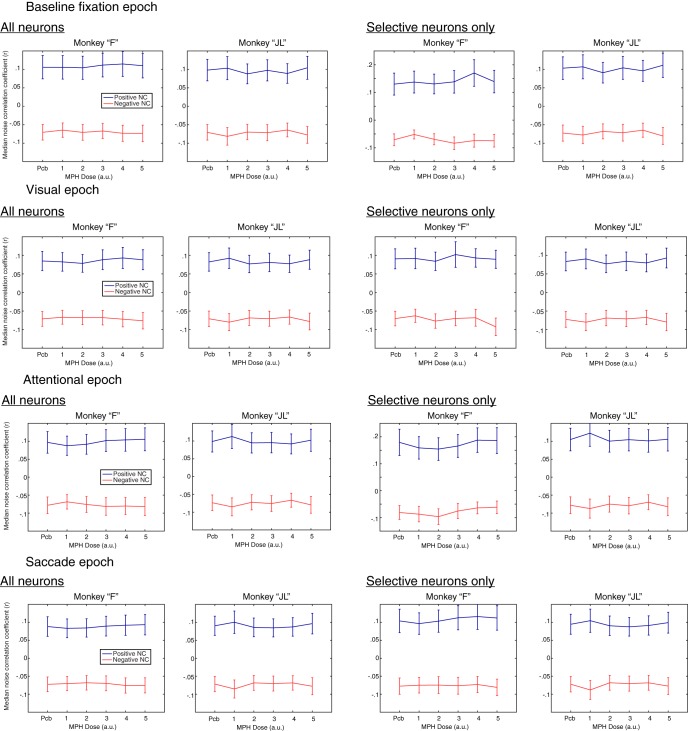
Figure 5.
Effects of MPH on noise correlations. Each line illustrates the median noise correlation coefficient separately for positive and negative noise correlations (blue and red, respectively) as a function of drug dose (x-axis). The x-axis uses arbitrary units, from the smallest dose of MPH to the biggest for each monkey. These are 0.43, 0.86, 1.08, 1.29, or 1.72 mg/kg for monkey “F,” and 0.33, 0.67, 0.83, 1.00, or 1.33 mg/kg for monkey “JL.” The left column presents results from analyses including all recorded neurons, independent of their selectivity. The right column includes only neurons that were selective (i.e., tuned) for the corresponding epoch. Since no tuning can be measured during the baseline fixation epoch, visual tuning was used as a replacement in this analysis. Each column presents results for each monkey independently.

