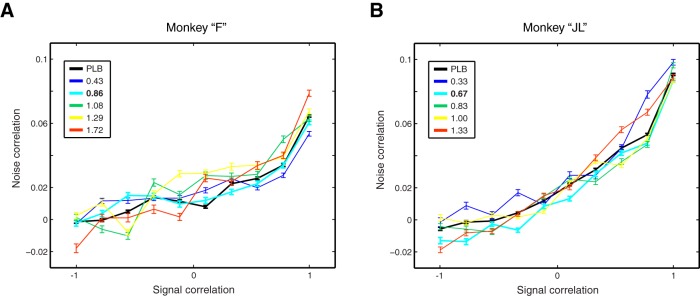
Figure 6.
Effects of MPH on noise correlation structure. A, Relationship between the signal correlation (i.e., tuning similarity) and noise correlation between every possible pairs of simultaneously recorded neurons, presented for each drug dose (colored lines). As expected, the more similar is the tuning between two neurons, the more noise they share through common inputs. B, Same as in A, although for monkey “JL.” Best dose of MPH based on behavioral performance is in bold in the legend. Error bars represent SEM.

