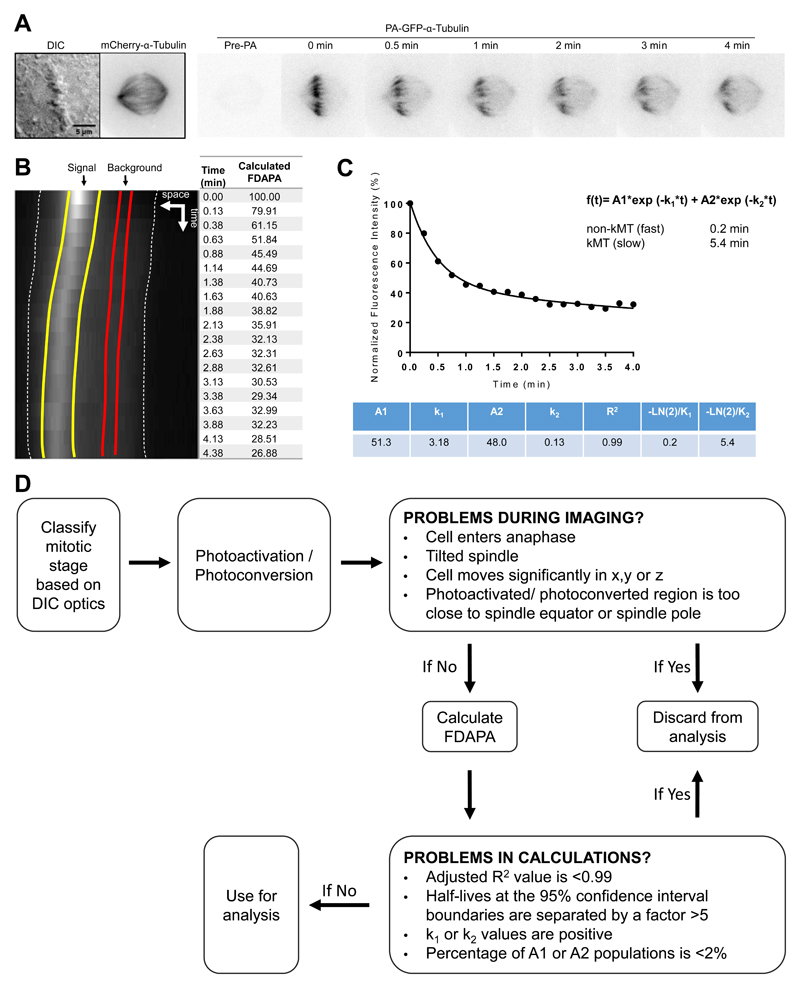
Fig. 7.
Calculating MT turnover through photoactivation. A. DIC and time-lapse fluorescent images of a representative metaphase U2OS cell expressing PA-GFP-α-tubulin and mCherry-α-tubulin. The mitotic spindle is visualized by mCherry fluorescence. Fluorescent images are inverted for better visualization of the photoactivated GFP molecules. B. Sum-projected, whole-spindle kymograph generated to quantify the Fluorescence Dissipation After Photo-Activation (FDAPA). Dashed white lines indicate the spindle poles; yellow lines indicate the boundaries used to quantify the signal generated from PA; red lines indicate the boundaries used for determining background levels. C. Normalized fluorescence intensity. Once fitted as a double exponential curve, the values obtained allow for the calculation of the dynamics of fast and slow MT populations. D. Photoactivation troubleshooting flowchart used to determine the exclusion criteria for calculating MT turnover using PA.

