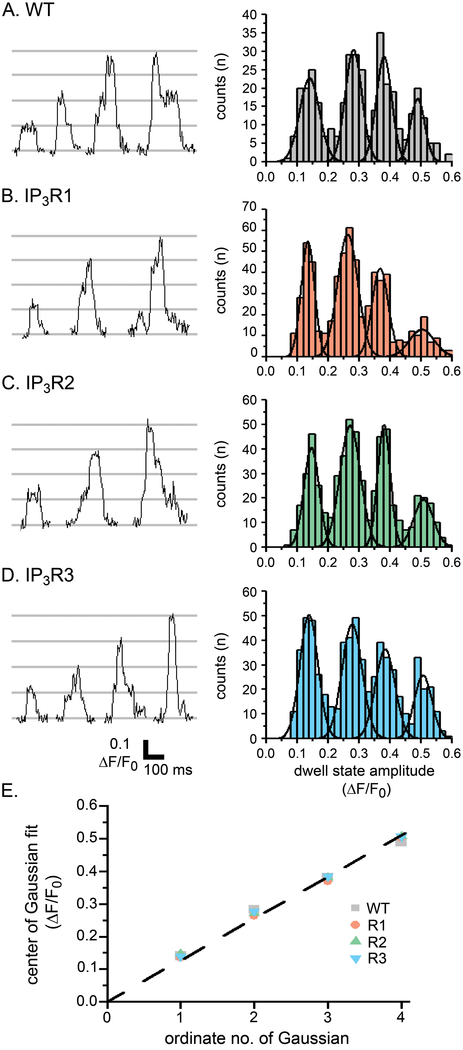
Fig. 4:
Quantal analysis of single-channel IP3R Ca2+ flux during Ca2+ puffs. (A) The traces on the left show representative puffs in a WT cell, presented on an expanded timescale to illustrate stepwise increments and decrements of fluorescence (ΔF/F0) resulting from the successive openings and closings of individual IP3R channels. Fluorescence measurements were made from 1.5 × 1.5 μm regions of interest centered on puff sites. Horizontal lines drawn at integer multiples of fluorescence amplitude indicate the numbers of open channels during dwell times at different step amplitudes. The histogram shows the distribution of amplitudes (ΔF/F0) of visually identified mean dwell levels in WT cells. The curves show individual components of a multi (4) Gaussian fit to the distribution. Data are from 415 WT dwell states. (B-D) Corresponding examples of stepwise puffs and of step dwell-state amplitude distributions and multi-Gaussian fits to data from cells expressing exclusively IP3R1 (B), IP3R2 (C) and IP3R3 (D). Data are from 665 (IP3R1), 659 (IP3R2), and 696 (IP3R3) dwell states. (E) The graph shows the center values of the four Gaussian distributions against their ordinate number (1-4). Different symbols represent data from the different cell lines, as indicated. Symbols overlap where not visible. The line is a regression fit to data from all cell types, constrained to pass through the origin, with a slope of ΔF/F0 = 0.126 per unitary step level.

