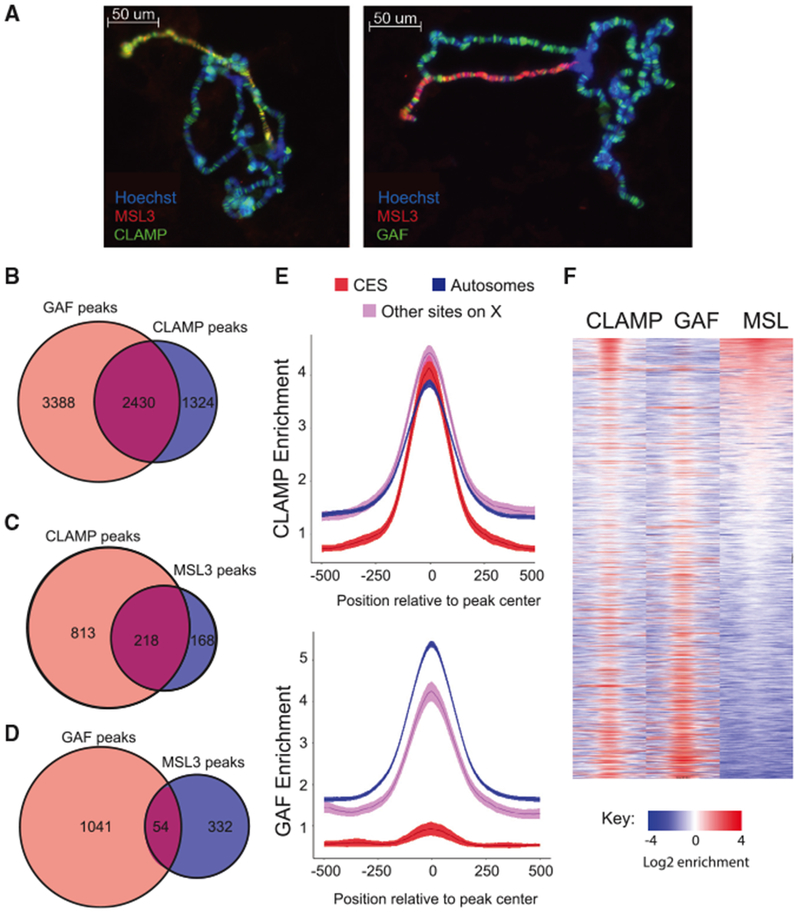
Figure 1. MSL Complex Binding Sites Have High CLAMP Occupancy and Low GAF Occupancy.

(A) Immunostaining of wild-type male Drosophila salivary gland polytene chromosomes. DNA is visualized with Hoechst staining (blue), while proteins are detected with Alexa Fluor secondary antibodies to identify MSL3 in red and CLAMP (left) or GAF (right) in green. Overlap in localization of CLAMP or GAF with MSL3 is observed in yellow.
(B) Venn diagram showing the number of GAF (light red) and CLAMP (blue) peaks and shared peaks where both GAF and CLAMP are present (purple).
(C) Venn diagrams showing the number of CLAMP (light red) or MSL3 (blue) peaks and peaks where both MSL3 and CLAMP are present (purple) on the X chromosome.
(D) Venn diagram showing the number of GAF (light red) or MSL3 (blue) peaks and peaks where both MSL3 and GAF are present (purple) on the X chromosome.
(E) Fold enrichment profiles of CLAMP (top) and GAF (bottom) from ChIP-seq data. Averages were plotted for peaks on autosomes (blue), CESs (red), and other sites on the X chromosome (pink), with the 95% confidence interval represented by shading around the line.
(F) Heatmap of 1 kb regions centered on CLAMP and/or GAF peaks on the X chromosome. White regions indicate background enrichment, while red and blue represent above (red) and below (blue) background enrichment, respectively (see key). Sites are rank-ordered by MSL3 enrichment.
