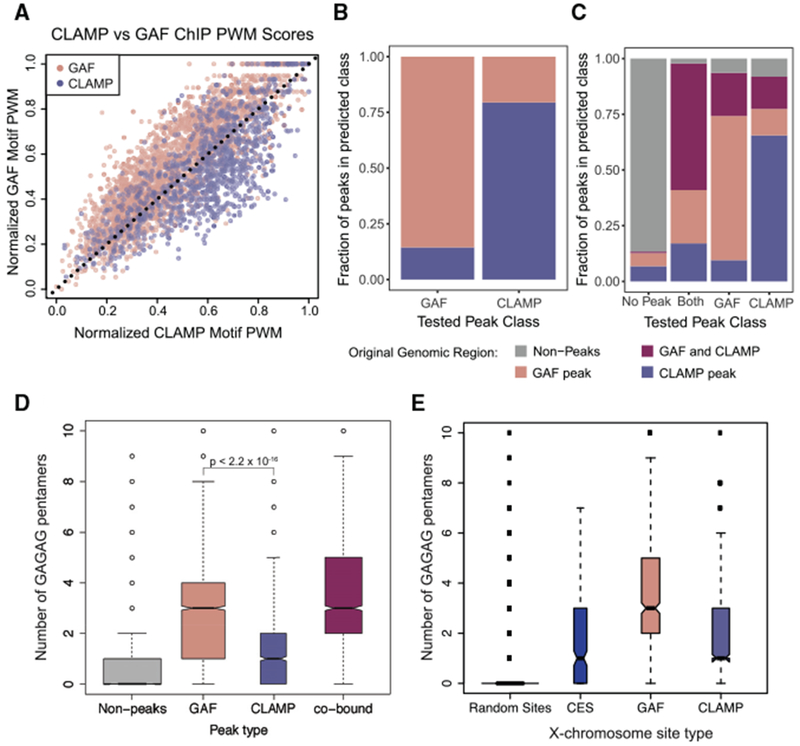
Figure 4. Factors beyond Sequence Motifs Are Predictive of CLAMP and GAF Binding.

(A) The position weight matrices (PWMs) of GAF and CLAMP unique motifs (Figure 3F) were normalized to the same scale and applied to non-co-bound GAF peaks and CLAMP peaks (Figure 1B). GAF motif scores for each peak are plotted on the y axis and CLAMP motif scores on the x axis, and a dotted line from (0,0) to (1,1) was drawn.
(B) The machine learning algorithm XGBoost (Chen and Guestrin, 2016) was used to develop a classifier model for using GAF-only and CLAMP-only peaks with features including PWMs (Figures 3C and 3F), chromatin states from the nine-state Drosophila genome model (Kharchenko et al., 2010), and the distance (in base pairs) to the nearest TSS. The x axis indicates peak category in the set of peaks used to test the model, and the y axis indicates the predictions from the classifier model.
(C) The machine learning algorithm XGBoost was used to develop a classifier model for using GAF-only, CLAMP-only, and GAF and CLAMP overlapping peaks along with randomly sampled regions of the genome with features including PWMs (Figures 3C and 3F), chromatin states from the nine-state Drosophila genome model (Kharchenko et al., 2010), and the distance (in base pairs) to the nearest TSS. The x axis indicates peak category in the set of peaks used to test the model, and the y axis indicates the predictions from the classifier model.
(D) Boxplot of the number of occurrences of the pentamer “GAGAG” within 214 bp of random sites in the genome outside of peaks (gray) or peak summit of GAF (light red), CLAMP (light blue), or co-bound (purple) peaks.
(E) Boxplot of the number of occurrences of the pentamer “GAGAG” within 214 bp of random sites on the X chromosome (gray), CES (blue), or peak summit of GAF (light red) or CLAMP (light blue) peaks.
