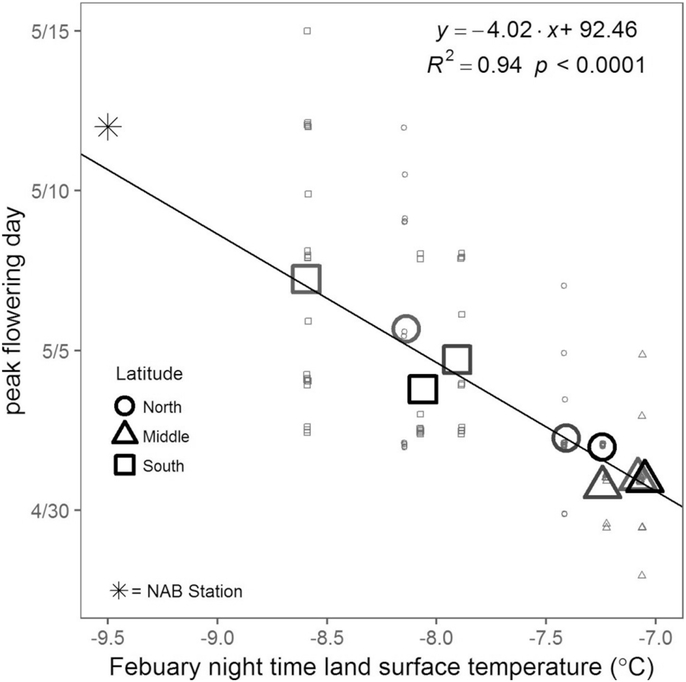
Fig. 3.
Peak flowering for all monitored oaks (large symbols: site means, dots: individual trees) as a function of average February night-time temperature. Estimated day of peak flowering for oak trees near the pollen counting station is also displayed (asterisk), but not included in the linear regression.

