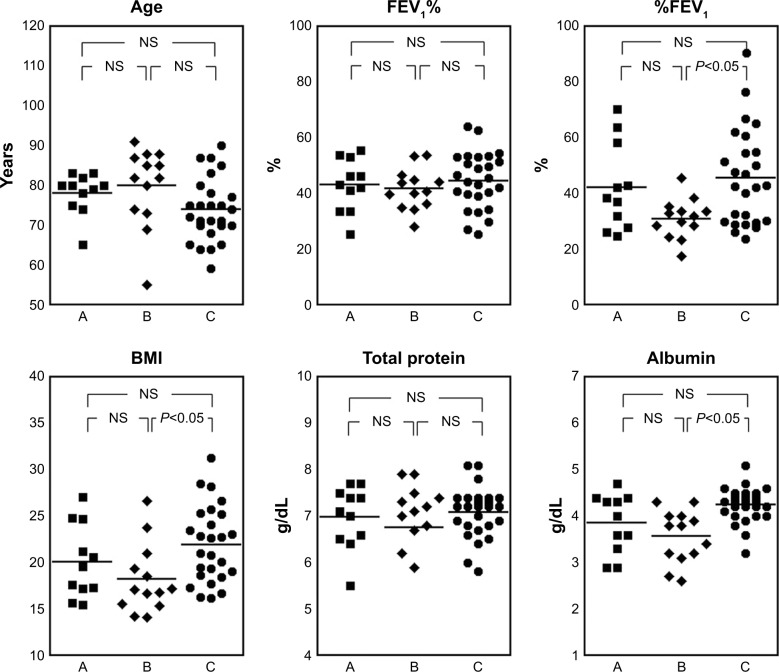
Figure 1.
Body mass index and total serum protein, serum albumin, and C-reactive protein levels in each study group.
Notes: The horizontal solid lines show the mean values in each group. The statistical analysis was performed using the Steel–Dwass method. A, AECOPD without bacterial infection (group A); B, AECOPD with bacterial infection (group B); C, COPD in a stable state, control (group C).
Abbreviations: AECOPD, acute exacerbation of COPD; FEV1%, forced expiratory volume in 1 second; %FEV1, percentage of predicted value for FEV1; NS, not statistically significant.

