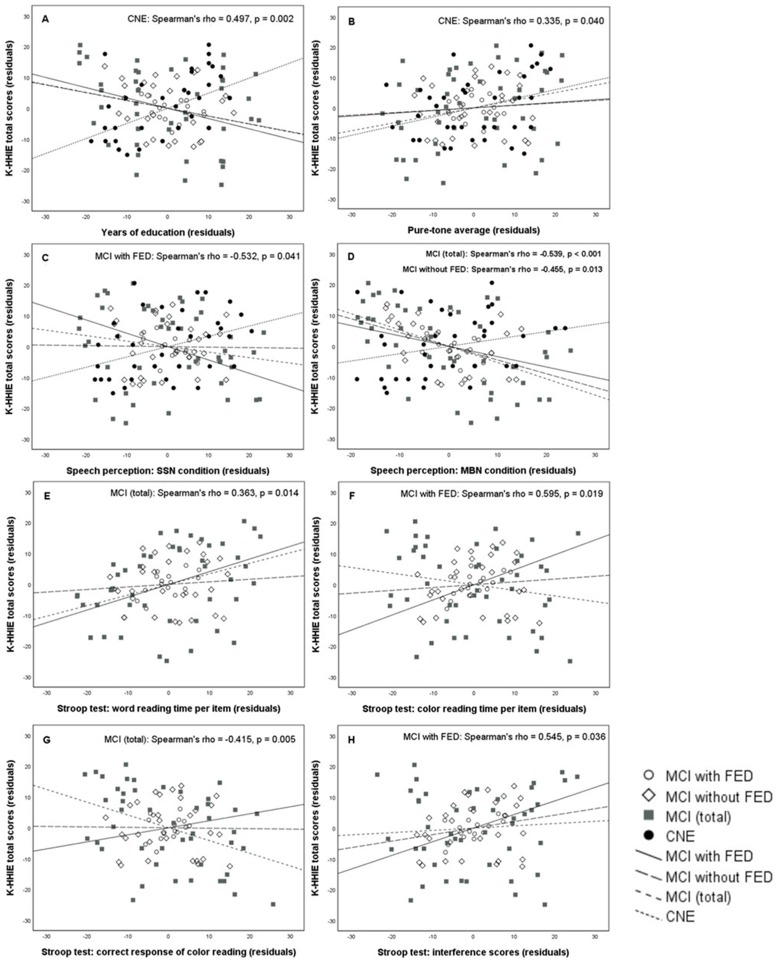
Fig 3. Scatter plots show the partial correlations between the K-HHIE total score and each of the eight variables in the MCI with FED, MCI without FED, total MCI, and CNE groups.
Variables: years of education (A); pure-tone average (B); sentence recognition scores in speech-spectrum noise (C) and multi-talker babble noise (D) conditions; and word reading time per item (E), color reading time per item (F), number of correct responses of color reading (G), and interference scores (H) in the K-CWST. For all panels, a group showing statistically significant correlation is displayed on the top right corner. For example, in the panel A, only the CNE group shows a statistically significant correlation between the K-HHIE total score and years of education.

