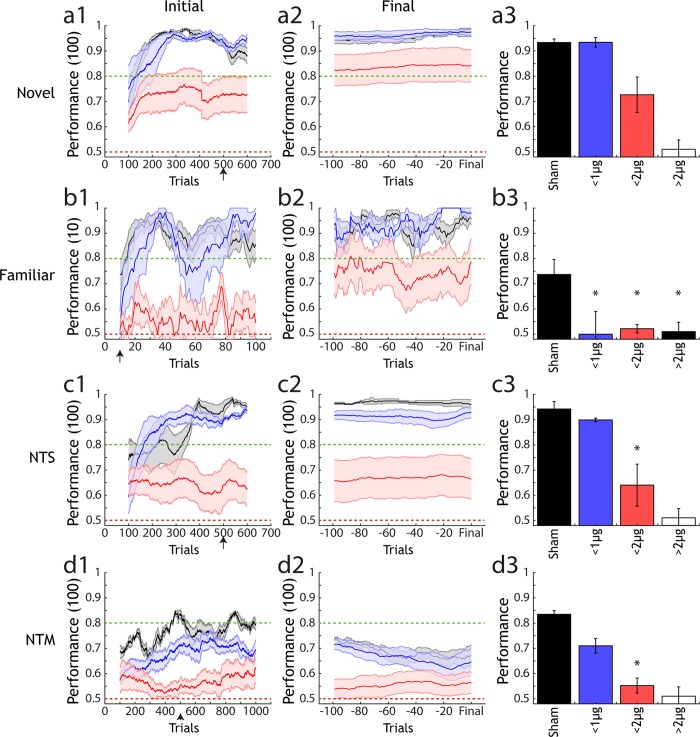
Fig 7. Analysis of performance across lesion groups and types of olfactory task.
(a1) Performance of 3 lesion size groups (sham: black, n = 9; <1000ng NMDA: blue, n = 5; <2000ng NMDA: red, n = 7) in a novel odour discrimination task (mean +/- sem). Performance is calculated over a 100 trial moving average. (a2) Final performance in the same groups as (a1), performance is calculated for each animal with a sliding window of 100 trials from 100 trials before- up to the final trial performed for each animal in the task. (a3) Average performance (mean +/- sem) for each group after the number of trials indicated by the black arrow on the x-axis in (a1). Final unfilled bar indicates estimated performance for the anosmic group, based on data gathered for (d3). * indicates significantly different performance compared to sham under 1-way ANOVA with Tukey-Kramer correction for multiple comparisons. (b1)-(b3), (c1)-(c3) and (d1)-(d3) are as in (a1)-(a3) but for a familiar odour task, non-trigeminal simple task (NTS) and non-trigeminal mixture task (NTM). In (d1)-(d3) performance is calculated in a 10 trial sliding window as the crucial metric for a familiar task is performance in the first few trials, where animals must rely on recognition of the previously learned pair rather than ongoing task learning.

