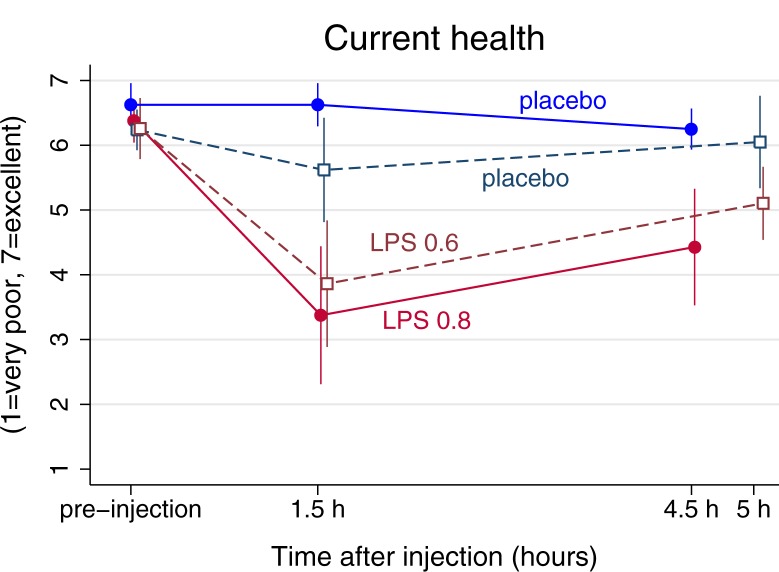
Fig 3. Changes in current self-rated health in response to lipopolysaccharide (LPS) and placebo.
In Experiment 1, measures were made on several time points prior and post to a LPS injection of 0.8ng/kg body weight (a solid red line with filled circles) or placebo (saline, a blue solid line with filled circles). In Experiment 2 injection with an LPS injection of 0.6ng/kg body weight (a red/marron dashed line and non-filled squares) and placebo (a navy blue dashed line with un-filled squares). Means and standard errors are depicted. 1 = very poor health, 7 = excellent health.

