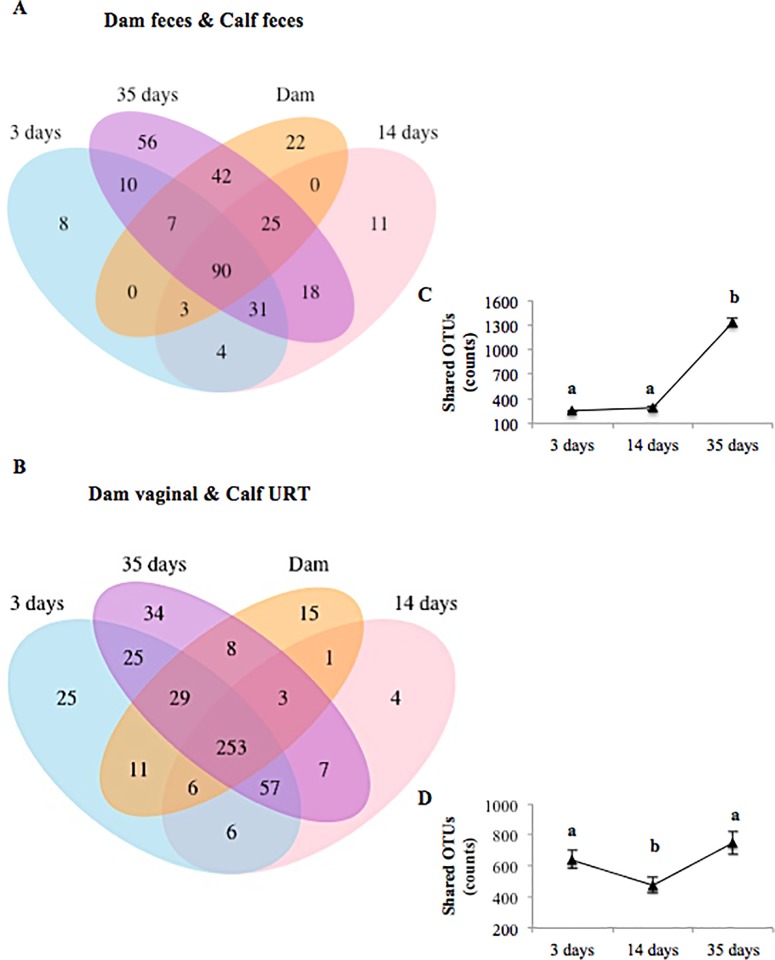
Fig 2.
Venn diagram showing the numbers of unique and shared OTUs between dam feces and calf feces over time (3, 14 and 35 days of life) (A) as well as between dam vaginal and calf upper respiratory tract (URT) over time (B). Line graphs showing shared OTU counts between dam feces and calf feces (C) as well as between dam vaginal and calf URT over time (D). OTUs were defined at 97% sequence similarity. Error bars represent the 95% confidence interval. a,b different superscripts represent a significant difference (P < 0.05).

