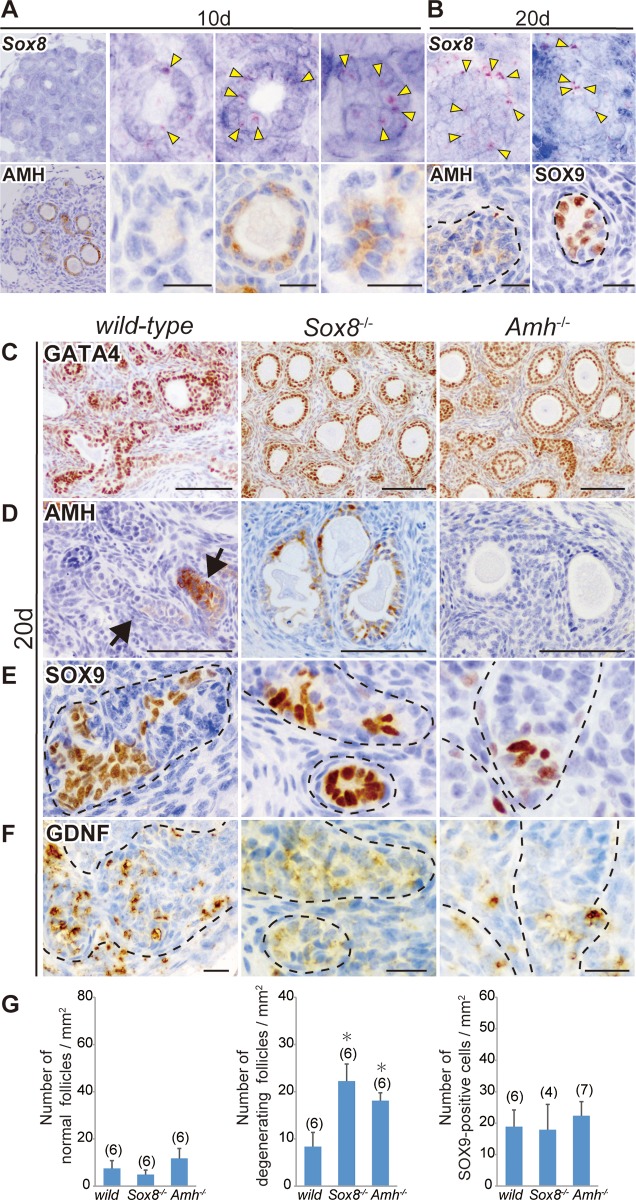
Fig 3. Sox8 expression in AMH-positive and -negative degenerating follicles and masculinized phenotypes of the Sox8-null and Amh-null ovaries transplanted into male host mice.
(A, B) In situ hybridization using a Sox8 antisense probe and anti-AMH immunostaining of two serial ovarian tissue sections grafted into XY-host on days 10 (A; The most left panels are lower and the others are higher magnified images) and 20 (B) post-transplantation. Sox8-positive signals (yellow arrowheads) were detected in the granulosa cells of AMH-negative and -positive degenerating follicles on day 10 post-transplantation, as well as in tubular structures, including SOX9-positive Sertoli-like cells on day 20 post-transplantation. (C–F) Anti-GATA4, AMH, SOX9, or GDNF immunostaining of wild-type, Sox8-null (Sox8-/-), or Amh-null (Amh-/-) ovarian tissues grafted into XY-host on day 20 post-transplantation. The gonadal area is identified by GATA4 staining (C). Degenerating follicles were frequently seen in either Sox8-null or Amh-null grafted ovaries even at this stage (C, D). In contrast, the tubular structure formation (arrows or broken outlines) and ectopic appearance of SOX9-positive Sertoli-like cells in GDNF-positive tubular structures are found in all three types of grafted ovaries (E, F). (G) Bar graphs indicate the relative numbers of normal healthy follicles (left), degenerating follicles (center), and SOX9-positive cells (right) per gonadal area (mm2) in wild-type, Sox8-null, or Amh-null grafts in male host mice. The Sox8-null or Amh-null ovarian explants exhibited a large number of degenerating follicles even on day 20 post-transplantation, but no changes in the number of SOX9-positive cells were detected among the three genotypes. The data are expressed as means ± SEM (*p<0.05 as compared with wild-type host value, Dunnett's test). The numbers in parentheses indicate the number of explants used in each host. Broken lines indicate the border of tubular structures. Scale bars, 20 μm for (A, B, F); 100 μm for (C, D).

