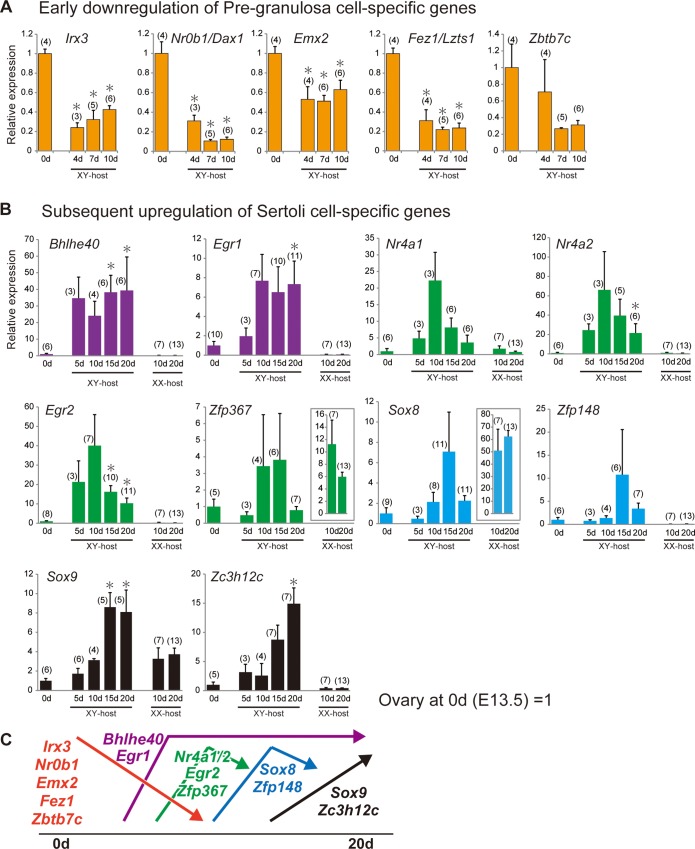
Fig 5. Temporal changes in the expression levels of each pre-granulosa/Sertoli cell-specific gene encoding a transcription/nuclear factor in grafted ovaries.
(A–B) Bar graphs showing temporal changes in the expression levels (y-axis) of pre-granulosa (A) and Sertoli cell-specific genes (B) in ovarian grafts in male and female host mice on each day post-transplantation (x-axis). The data are expressed as means ± SEM. The expression levels on day 0 post-transplantation (i.e., the ovaries isolated from the 13.0-dpc embryos pretreated with busulfan) were set as 1.0 on the y-axis (*p<0.05 as compared with day 0, Dunnett’s test or Steel’s test). The numbers in parentheses indicate the number of explants used at each stage. (C) Expression profile categories for pre-granulosa or Sertoli cell-specific genes in grafted ovaries during partial masculinization.

