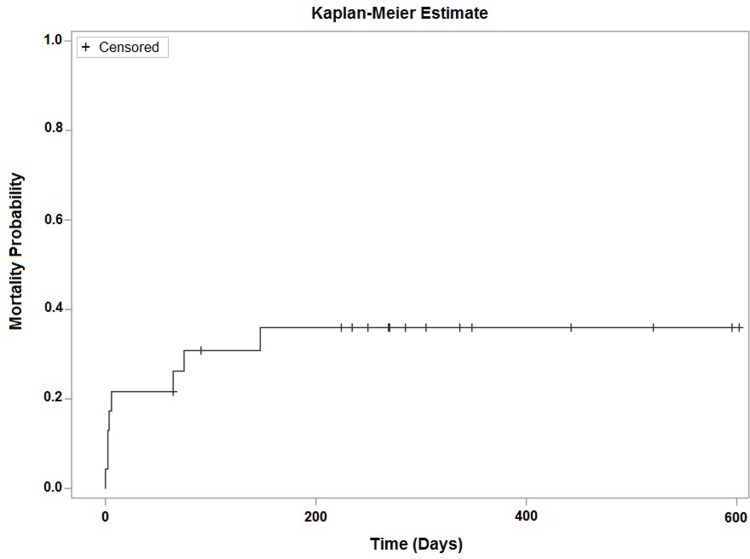
Fig 2. Kaplan-Meier plot–time to pregnancy (days) (n = 23a).
aPatients were only included in the analysis if an intervention start date was available. Follow-up time was calculated as time from intervention start date to conception date or intervention start date to study exit date, whichever occurred first.

